- South Korea
- /
- Personal Products
- /
- KOSE:A078520
Able C&C Co., Ltd.'s (KRX:078520) Stock Is Rallying But Financials Look Ambiguous: Will The Momentum Continue?


Able C&C (KRX:078520) has had a great run on the share market with its stock up by a significant 66% over the last three months. However, we wonder if the company's inconsistent financials would have any adverse impact on the current share price momentum. In this article, we decided to focus on Able C&C's ROE.
Return on Equity or ROE is a test of how effectively a company is growing its value and managing investors’ money. In simpler terms, it measures the profitability of a company in relation to shareholder's equity.
Check out our latest analysis for Able C&C
How Is ROE Calculated?
The formula for ROE is:
Return on Equity = Net Profit (from continuing operations) ÷ Shareholders' Equity
So, based on the above formula, the ROE for Able C&C is:
7.4% = ₩6.5b ÷ ₩87b (Based on the trailing twelve months to March 2024).
The 'return' refers to a company's earnings over the last year. One way to conceptualize this is that for each ₩1 of shareholders' capital it has, the company made ₩0.07 in profit.
What Has ROE Got To Do With Earnings Growth?
So far, we've learned that ROE is a measure of a company's profitability. We now need to evaluate how much profit the company reinvests or "retains" for future growth which then gives us an idea about the growth potential of the company. Assuming everything else remains unchanged, the higher the ROE and profit retention, the higher the growth rate of a company compared to companies that don't necessarily bear these characteristics.
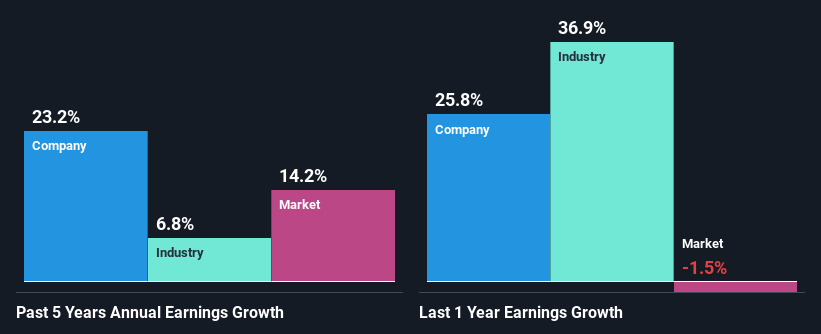
A Side By Side comparison of Able C&C's Earnings Growth And 7.4% ROE
At first glance, Able C&C's ROE doesn't look very promising. However, given that the company's ROE is similar to the average industry ROE of 6.8%, we may spare it some thought. Particularly, the exceptional 23% net income growth seen by Able C&C over the past five years is pretty remarkable. Given the slightly low ROE, it is likely that there could be some other aspects that are driving this growth. For example, it is possible that the company's management has made some good strategic decisions, or that the company has a low payout ratio.
As a next step, we compared Able C&C's net income growth with the industry, and pleasingly, we found that the growth seen by the company is higher than the average industry growth of 6.8%.
Earnings growth is an important metric to consider when valuing a stock. What investors need to determine next is if the expected earnings growth, or the lack of it, is already built into the share price. By doing so, they will have an idea if the stock is headed into clear blue waters or if swampy waters await. Is Able C&C fairly valued compared to other companies? These 3 valuation measures might help you decide.
Is Able C&C Efficiently Re-investing Its Profits?
The really high three-year median payout ratio of 590% for Able C&C suggests that the company is paying its shareholders more than what it is earning. Despite this, the company's earnings grew significantly as we saw above. Although, it could be worth keeping an eye on the high payout ratio as that's a huge risk. You can see the 2 risks we have identified for Able C&C by visiting our risks dashboard for free on our platform here.
Besides, Able C&C has been paying dividends for at least ten years or more. This shows that the company is committed to sharing profits with its shareholders.
Conclusion
In total, we're a bit ambivalent about Able C&C's performance. While no doubt its earnings growth is pretty substantial, its ROE and earnings retention is quite poor. So while the company has managed to grow its earnings in spite of this, we are unconvinced if this growth could extend, especially during troubled times. So far, we've only made a quick discussion around the company's earnings growth. So it may be worth checking this free detailed graph of Able C&C's past earnings, as well as revenue and cash flows to get a deeper insight into the company's performance.
New: Manage All Your Stock Portfolios in One Place
We've created the ultimate portfolio companion for stock investors, and it's free.
• Connect an unlimited number of Portfolios and see your total in one currency
• Be alerted to new Warning Signs or Risks via email or mobile
• Track the Fair Value of your stocks
Have feedback on this article? Concerned about the content? Get in touch with us directly. Alternatively, email editorial-team (at) simplywallst.com.
This article by Simply Wall St is general in nature. We provide commentary based on historical data and analyst forecasts only using an unbiased methodology and our articles are not intended to be financial advice. It does not constitute a recommendation to buy or sell any stock, and does not take account of your objectives, or your financial situation. We aim to bring you long-term focused analysis driven by fundamental data. Note that our analysis may not factor in the latest price-sensitive company announcements or qualitative material. Simply Wall St has no position in any stocks mentioned.
Have feedback on this article? Concerned about the content? Get in touch with us directly. Alternatively, email editorial-team@simplywallst.com
About KOSE:A078520
Able C&C
Manufactures, distributes, retails, and sells cosmetics and household goods in South Korea, China, Japan, rest of Asia, Europe, and North and Central America.
Solid track record with excellent balance sheet.

