3-D Matrix Full Year 2024 Earnings: JP¥3.48 loss per share (vs JP¥40.62 loss in FY 2023)


3-D Matrix (TSE:7777) Full Year 2024 Results
Key Financial Results
- Revenue: JP¥4.59b (up 98% from FY 2023).
- Net loss: JP¥255.0m (loss narrowed by 90% from FY 2023).
- JP¥3.48 loss per share (improved from JP¥40.62 loss in FY 2023).
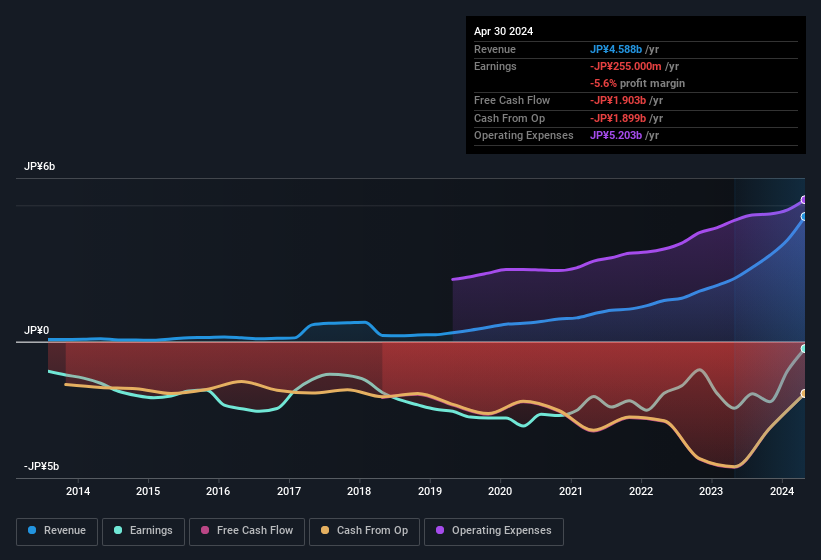
All figures shown in the chart above are for the trailing 12 month (TTM) period
3-D Matrix shares are down 15% from a week ago.
Risk Analysis
Before you take the next step you should know about the 4 warning signs for 3-D Matrix (1 makes us a bit uncomfortable!) that we have uncovered.
Valuation is complex, but we're here to simplify it.
Discover if 3-D Matrix might be undervalued or overvalued with our detailed analysis, featuring fair value estimates, potential risks, dividends, insider trades, and its financial condition.
Access Free AnalysisHave feedback on this article? Concerned about the content? Get in touch with us directly. Alternatively, email editorial-team (at) simplywallst.com.
This article by Simply Wall St is general in nature. We provide commentary based on historical data and analyst forecasts only using an unbiased methodology and our articles are not intended to be financial advice. It does not constitute a recommendation to buy or sell any stock, and does not take account of your objectives, or your financial situation. We aim to bring you long-term focused analysis driven by fundamental data. Note that our analysis may not factor in the latest price-sensitive company announcements or qualitative material. Simply Wall St has no position in any stocks mentioned.
Have feedback on this article? Concerned about the content? Get in touch with us directly. Alternatively, email editorial-team@simplywallst.com
About TSE:7777
3-D Matrix
Develops self-assembling peptide technology in Japan and internationally.
Low and slightly overvalued.

