Advertisement
DIC (TSE:4631): Examining Valuation After Recent Share Price Momentum

Simply Wall St
Reviewed by Simply Wall St
DIC (TSE:4631) has caught investor interest recently, especially given its steady performance in the past quarter. With shares seeing respectable gains over the past 3 months, many are now taking a closer look at what is driving this momentum.
See our latest analysis for DIC.
DIC's recent 19.4% three-month share price return has outpaced its full-year pace, suggesting renewed momentum is building. With a one-year total shareholder return of nearly 16% and multi-year gains surpassing 60%, the stock is making its mark among materials sector peers.
If DIC’s steady run has you watching for next big movers, now is a smart time to broaden your outlook and discover fast growing stocks with high insider ownership
Yet with this recent upswing and notable long-term gains, the real question now is whether DIC remains undervalued or if the market has already priced in all future growth, which could leave little room for further upside.
Price-to-Earnings of 12.3x: Is it justified?
DIC’s shares recently changed hands at a price-to-earnings (P/E) ratio of 12.3x. This makes it appear more attractively valued than both its peers and the wider Japanese chemicals industry. For investors, this is a clear signal that the company is being priced at a discount compared to the competition and the sector’s own average.
The P/E ratio measures how much the market is willing to pay for one unit of the company’s earnings. It is widely used to gauge whether a stock is undervalued or overvalued relative to its earnings power and is especially useful in mature sectors such as chemicals where earnings are a key driver of value. A lower P/E suggests the market is either overlooking potential upside or discounting the company’s growth prospects.
Looking closer, DIC’s 12.3x multiple is not only below the JP Chemicals industry average of 13x, but it also trades at a substantial discount to the peer group, where the average P/E is 23x. Regression-based fair value models estimate DIC’s fair P/E at 14.8x. This indicates there may be room for re-rating if market perceptions improve and earnings trends hold steady.
Explore the SWS fair ratio for DIC
Result: Price-to-Earnings of 12.3x (UNDERVALUED)
However, unexpected shifts in industry demand or slower than anticipated earnings growth could quickly challenge this undervaluation story.
Find out about the key risks to this DIC narrative.
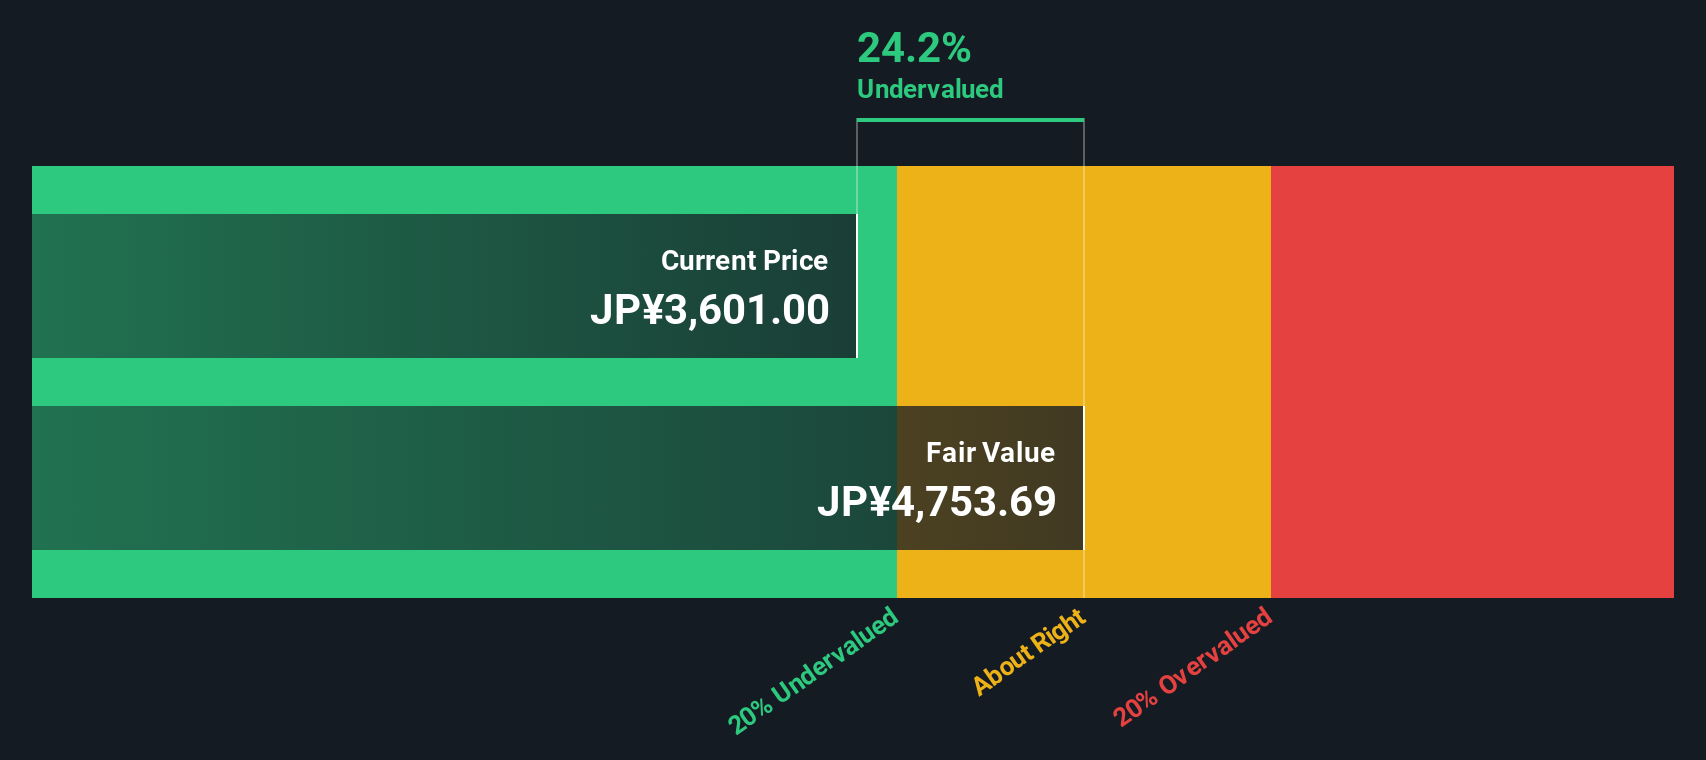
Another View: What Does Our DCF Model Say?
Switching perspectives, the SWS DCF model offers a different angle. It suggests DIC is undervalued by about 24%, estimating fair value at ¥4,775 compared to the market price of ¥3,632. Does this deeper discount reflect untapped upside or hidden risks for shareholders?
Look into how the SWS DCF model arrives at its fair value.
Simply Wall St performs a discounted cash flow (DCF) on every stock in the world every day (check out DIC for example). We show the entire calculation in full. You can track the result in your watchlist or portfolio and be alerted when this changes, or use our stock screener to discover 832 undervalued stocks based on their cash flows. If you save a screener we even alert you when new companies match - so you never miss a potential opportunity.
Build Your Own DIC Narrative
If you want to dig into the details or uncover your own angle, it only takes a few minutes to build a perspective with your own data insights. Do it your way
A great starting point for your DIC research is our analysis highlighting 4 key rewards and 2 important warning signs that could impact your investment decision.
Looking for more investment ideas?
Don't let opportunity pass you by. The right screener can help you spot breakthrough stocks before everyone else. If you're serious about your portfolio, make the most of these carefully selected ideas:
- Spot emerging technology trends and get ahead by checking out the potential of these 26 AI penny stocks for AI-driven growth.
- Capture attractive income streams and enhance your returns by browsing these 22 dividend stocks with yields > 3% yielding strong, consistent payouts.
- Capitalize on untapped opportunities and value buys when you scan these 832 undervalued stocks based on cash flows based on real cash flows and smart fundamentals.
This article by Simply Wall St is general in nature. We provide commentary based on historical data and analyst forecasts only using an unbiased methodology and our articles are not intended to be financial advice. It does not constitute a recommendation to buy or sell any stock, and does not take account of your objectives, or your financial situation. We aim to bring you long-term focused analysis driven by fundamental data. Note that our analysis may not factor in the latest price-sensitive company announcements or qualitative material. Simply Wall St has no position in any stocks mentioned.
New: Manage All Your Stock Portfolios in One Place
We've created the ultimate portfolio companion for stock investors, and it's free.
• Connect an unlimited number of Portfolios and see your total in one currency
• Be alerted to new Warning Signs or Risks via email or mobile
• Track the Fair Value of your stocks
Have feedback on this article? Concerned about the content? Get in touch with us directly. Alternatively, email editorial-team@simplywallst.com
About TSE:4631
DIC
Manufactures and sells printing inks, organic pigments, and synthetic resins worldwide.
Undervalued average dividend payer.
Similar Companies
Market Insights

Advertisement
Community Narratives
The company that turned a verb into a global necessity and basically runs the modern internet, digital ads, smartphones, maps, and AI.
Fair Value US$300.00|6.3% undervalued
OS
Community Contributor
Flowers Foods Pays A Fair Price For Health
Fair Value US$16.12|26.0% undervalued
NV
Community Contributor
TMX Group will thrive with 33.3% profit margin and enduring market moat
Fair Value CA$49.90|3.7% overvalued
LI
Community Contributor