Advertisement
- Japan
- /
- Commercial Services
- /
- TSE:4665
Duskin (TSE:4665): Assessing Valuation Following Strong H1 FY2025 Results and Strategic Updates

Simply Wall St
Reviewed by Simply Wall St
Duskin (TSE:4665) shared its first half results for FY2025, posting higher net sales and profits compared to last year. Alongside these improvements, the company updated its scope of consolidation, which may indicate a potential shift in strategy.
See our latest analysis for Duskin.
The latest results seem to have put a bit of spark into Duskin’s shares, with a 1.61% bump in the last trading day and positive momentum carrying its year-to-date share price return to nearly 2%. That said, the real story lies in Duskin’s longer-term resilience. Its three-year total shareholder return stands at an impressive 41%, showing steady wealth creation despite recent strategy shifts and business updates.
If news of Duskin’s business tweaks has you curious about what else is gaining traction, now’s the time to branch out and discover fast growing stocks with high insider ownership
With the stock posting solid long-term gains but now trading well above analyst price targets, investors are left wondering if Duskin is undervalued and poised for more upside, or if the market has already priced in its next chapter of growth.
Price-to-Earnings of 19.4x: Is it justified?
Duskin currently trades at a price-to-earnings (P/E) ratio of 19.4x, which puts the stock at a considerable premium compared to both sector peers and model-based benchmarks.
The price-to-earnings ratio compares a company's share price to its per-share earnings, serving as a popular yardstick for valuing service businesses like Duskin. A higher P/E can indicate that investors are betting on outsized profit growth, but it could also signal inflated expectations or overlooked risks.
In Duskin’s case, the 19.4x P/E is not only above the industry average of 12.8x, but it also exceeds an estimated “fair” P/E of 15.7x. This suggests the current valuation appears difficult to justify based solely on company fundamentals, and there is a risk the stock price could move toward the sector average or fair ratio level if profit growth does not accelerate meaningfully. The market is clearly rewarding Duskin with a premium, but the evidence in the numbers might not support this valuation.
Explore the SWS fair ratio for Duskin
Result: Price-to-Earnings of 19.4x (OVERVALUED)
However, continued below-target profit growth or a reversal in recent revenue trends could challenge Duskin’s current valuation and potentially pressure its elevated share price.
Find out about the key risks to this Duskin narrative.
Another View: Discounted Cash Flow Suggests Even Greater Caution
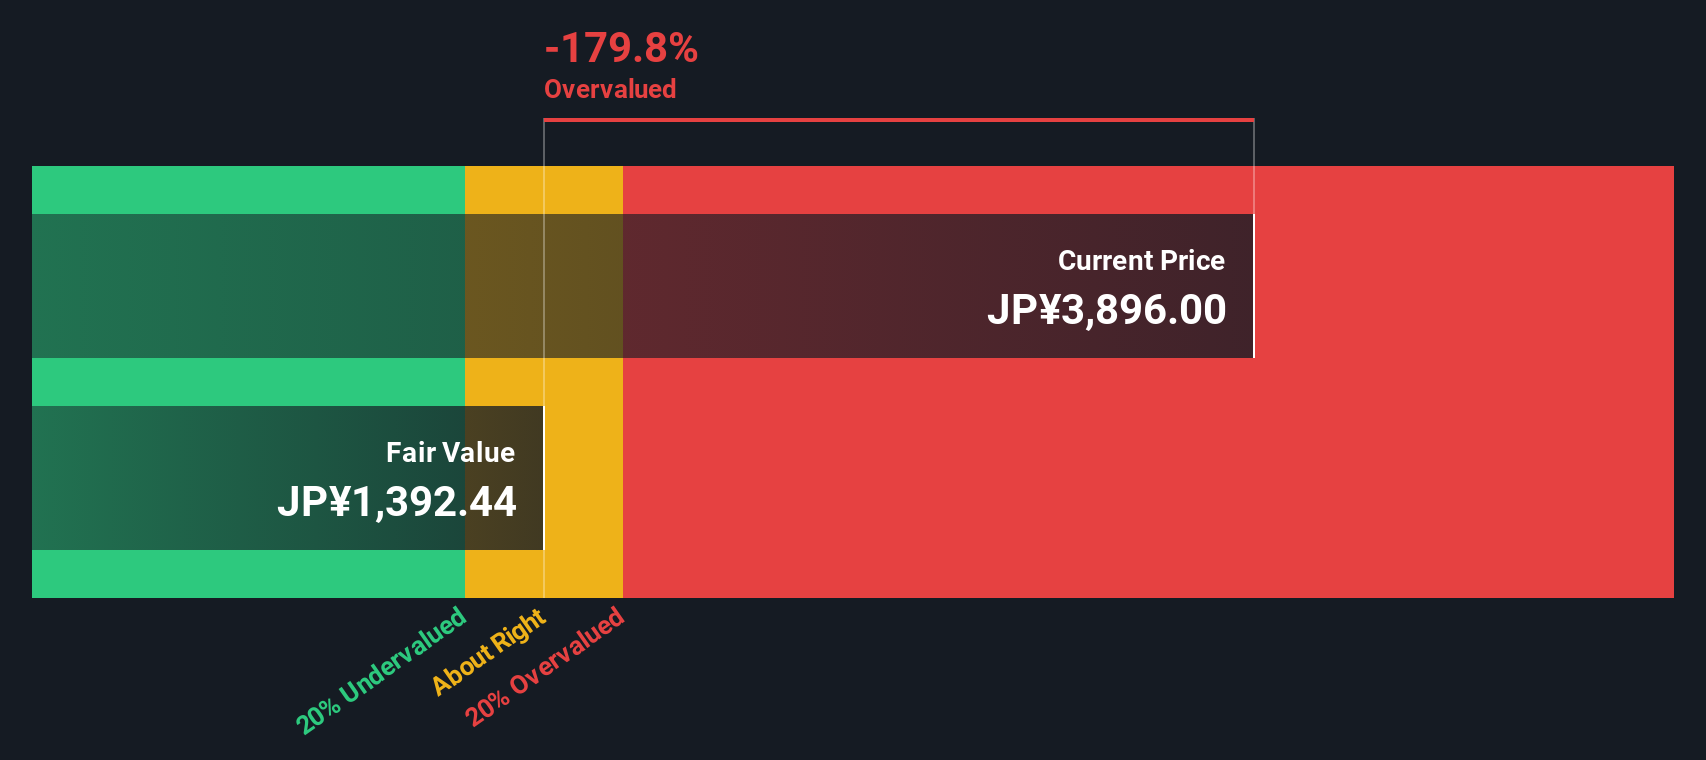
Looking at Duskin through the lens of our DCF model provides an even starker picture. While the current share price sits at ¥3,789, the SWS DCF model estimates fair value closer to ¥1,392. This suggests Duskin could be trading at a material premium, raising further doubts about value at current levels. Could these two models both be missing something? Is the market simply expecting more than the fundamentals suggest?
Look into how the SWS DCF model arrives at its fair value.
Simply Wall St performs a discounted cash flow (DCF) on every stock in the world every day (check out Duskin for example). We show the entire calculation in full. You can track the result in your watchlist or portfolio and be alerted when this changes, or use our stock screener to discover 870 undervalued stocks based on their cash flows. If you save a screener we even alert you when new companies match - so you never miss a potential opportunity.
Build Your Own Duskin Narrative
If you have a different perspective or want to test your own approach to the numbers, it takes less than three minutes to craft your own view. Do it your way
A great starting point for your Duskin research is our analysis highlighting 2 key rewards and 2 important warning signs that could impact your investment decision.
Looking for more investment ideas?
Smart investing means always staying ahead, and Simply Wall St’s tailored screeners make it easy to spot your next opportunity before the crowd rushes in. Don’t miss out on timely ideas uniquely matched to your interests and strategy.
- Boost your portfolio with consistent payouts when you check out these 16 dividend stocks with yields > 3% offering yields above 3% and solid financial health.
- Unlock the potential of tomorrow’s disruptors by browsing these 24 AI penny stocks with strong growth profiles riding the artificial intelligence wave.
- Position yourself for long-term value with these 870 undervalued stocks based on cash flows based on compelling cash flow metrics and market mispricings.
This article by Simply Wall St is general in nature. We provide commentary based on historical data and analyst forecasts only using an unbiased methodology and our articles are not intended to be financial advice. It does not constitute a recommendation to buy or sell any stock, and does not take account of your objectives, or your financial situation. We aim to bring you long-term focused analysis driven by fundamental data. Note that our analysis may not factor in the latest price-sensitive company announcements or qualitative material. Simply Wall St has no position in any stocks mentioned.
New: Manage All Your Stock Portfolios in One Place
We've created the ultimate portfolio companion for stock investors, and it's free.
• Connect an unlimited number of Portfolios and see your total in one currency
• Be alerted to new Warning Signs or Risks via email or mobile
• Track the Fair Value of your stocks
Have feedback on this article? Concerned about the content? Get in touch with us directly. Alternatively, email editorial-team@simplywallst.com
About TSE:4665
Duskin
Engages in the environmental hygiene and food businesses in Japan and internationally.
Solid track record with excellent balance sheet and pays a dividend.
Similar Companies
Market Insights

Advertisement
Community Narratives
The "Molecular Pencil": Why Beam's Technology is Built to Win
Fair Value US$65.01|65.4% undervalued
DA
Community Contributor
The silent giant behind virtually every advanced chip powering AI, smartphones, and modern infrastructure.
Fair Value US$310.00|6.1% undervalued
OS
Community Contributor
ADP Stock: Solid Fundamentals, But AI Investments Test Its Margin Resilience
Fair Value US$387.77|34.2% undervalued
YI
Community Contributor
MINISO's fair value is projected at 26.69 with an anticipated PE ratio shift of 20x
Fair Value US$24.03|9.6% undervalued
BE
Community Contributor