- Japan
- /
- Trade Distributors
- /
- TSE:8002
Are Strong Financial Prospects The Force That Is Driving The Momentum In Marubeni Corporation's TSE:8002) Stock?


Marubeni's (TSE:8002) stock is up by a considerable 26% over the past three months. Given that the market rewards strong financials in the long-term, we wonder if that is the case in this instance. In this article, we decided to focus on Marubeni's ROE.
ROE or return on equity is a useful tool to assess how effectively a company can generate returns on the investment it received from its shareholders. Put another way, it reveals the company's success at turning shareholder investments into profits.
See our latest analysis for Marubeni
How Do You Calculate Return On Equity?
ROE can be calculated by using the formula:
Return on Equity = Net Profit (from continuing operations) ÷ Shareholders' Equity
So, based on the above formula, the ROE for Marubeni is:
14% = JP¥483b ÷ JP¥3.6t (Based on the trailing twelve months to March 2024).
The 'return' is the yearly profit. One way to conceptualize this is that for each ¥1 of shareholders' capital it has, the company made ¥0.14 in profit.
What Has ROE Got To Do With Earnings Growth?
We have already established that ROE serves as an efficient profit-generating gauge for a company's future earnings. We now need to evaluate how much profit the company reinvests or "retains" for future growth which then gives us an idea about the growth potential of the company. Assuming everything else remains unchanged, the higher the ROE and profit retention, the higher the growth rate of a company compared to companies that don't necessarily bear these characteristics.
A Side By Side comparison of Marubeni's Earnings Growth And 14% ROE
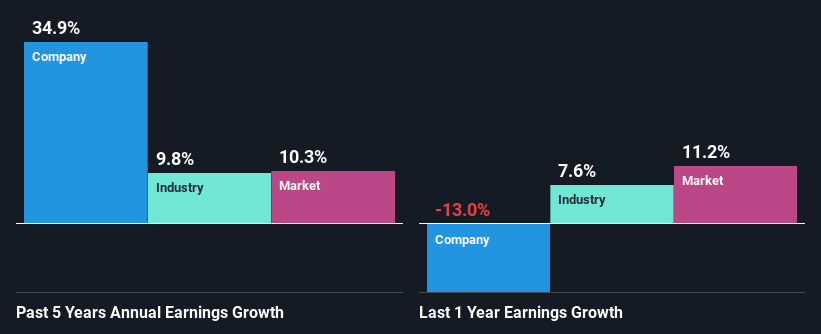
To start with, Marubeni's ROE looks acceptable. On comparing with the average industry ROE of 8.0% the company's ROE looks pretty remarkable. This probably laid the ground for Marubeni's significant 35% net income growth seen over the past five years. We believe that there might also be other aspects that are positively influencing the company's earnings growth. Such as - high earnings retention or an efficient management in place.
As a next step, we compared Marubeni's net income growth with the industry, and pleasingly, we found that the growth seen by the company is higher than the average industry growth of 9.8%.
Earnings growth is an important metric to consider when valuing a stock. What investors need to determine next is if the expected earnings growth, or the lack of it, is already built into the share price. Doing so will help them establish if the stock's future looks promising or ominous. If you're wondering about Marubeni's's valuation, check out this gauge of its price-to-earnings ratio, as compared to its industry.
Is Marubeni Efficiently Re-investing Its Profits?
Marubeni's three-year median payout ratio is a pretty moderate 25%, meaning the company retains 75% of its income. By the looks of it, the dividend is well covered and Marubeni is reinvesting its profits efficiently as evidenced by its exceptional growth which we discussed above.
Besides, Marubeni has been paying dividends for at least ten years or more. This shows that the company is committed to sharing profits with its shareholders.
Summary
Overall, we are quite pleased with Marubeni's performance. In particular, it's great to see that the company is investing heavily into its business and along with a high rate of return, that has resulted in a sizeable growth in its earnings. With that said, the latest industry analyst forecasts reveal that the company's earnings growth is expected to slow down. To know more about the company's future earnings growth forecasts take a look at this free report on analyst forecasts for the company to find out more.
New: Manage All Your Stock Portfolios in One Place
We've created the ultimate portfolio companion for stock investors, and it's free.
• Connect an unlimited number of Portfolios and see your total in one currency
• Be alerted to new Warning Signs or Risks via email or mobile
• Track the Fair Value of your stocks
Have feedback on this article? Concerned about the content? Get in touch with us directly. Alternatively, email editorial-team (at) simplywallst.com.
This article by Simply Wall St is general in nature. We provide commentary based on historical data and analyst forecasts only using an unbiased methodology and our articles are not intended to be financial advice. It does not constitute a recommendation to buy or sell any stock, and does not take account of your objectives, or your financial situation. We aim to bring you long-term focused analysis driven by fundamental data. Note that our analysis may not factor in the latest price-sensitive company announcements or qualitative material. Simply Wall St has no position in any stocks mentioned.
About TSE:8002
Marubeni
Marubeni Corporation purchases, distributes, and markets industrial and consumer goods.
Excellent balance sheet established dividend payer.

