
Advertisement
Is Kawasaki Heavy Industries, Ltd. (TSE:7012) Worth JP¥9.7k Based On Its Intrinsic Value?
Key Insights
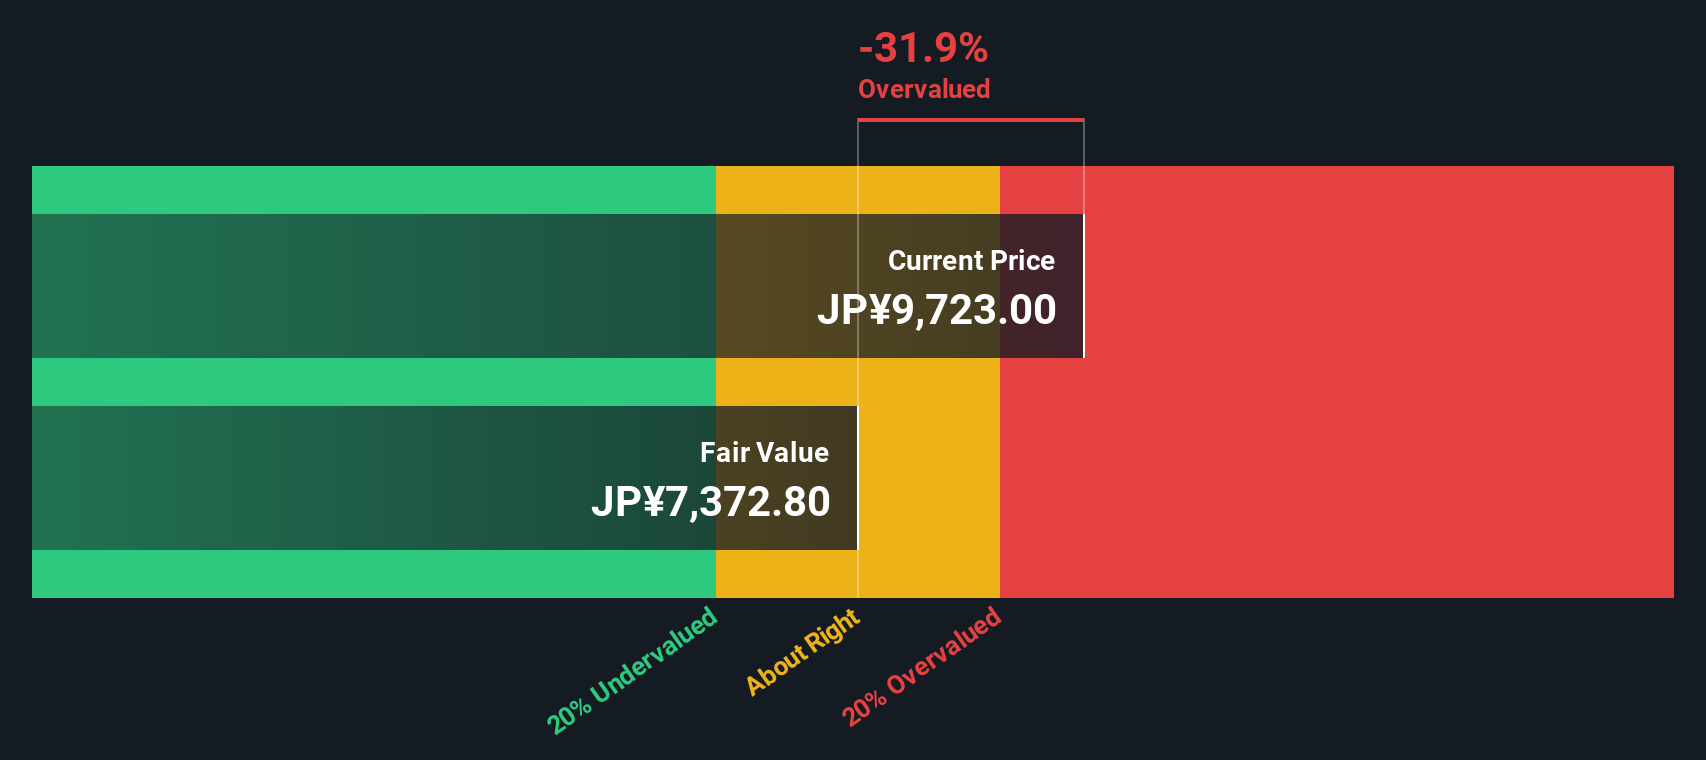
- Kawasaki Heavy Industries' estimated fair value is JP¥7,373 based on 2 Stage Free Cash Flow to Equity
- Current share price of JP¥9,723 suggests Kawasaki Heavy Industries is potentially 32% overvalued
- Analyst price target for 7012 is JP¥12,150, which is 65% above our fair value estimate
How far off is Kawasaki Heavy Industries, Ltd. (TSE:7012) from its intrinsic value? Using the most recent financial data, we'll take a look at whether the stock is fairly priced by taking the expected future cash flows and discounting them to today's value. We will take advantage of the Discounted Cash Flow (DCF) model for this purpose. It may sound complicated, but actually it is quite simple!
Companies can be valued in a lot of ways, so we would point out that a DCF is not perfect for every situation. If you still have some burning questions about this type of valuation, take a look at the Simply Wall St analysis model.
Is Kawasaki Heavy Industries Fairly Valued?
We are going to use a two-stage DCF model, which, as the name states, takes into account two stages of growth. The first stage is generally a higher growth period which levels off heading towards the terminal value, captured in the second 'steady growth' period. To start off with, we need to estimate the next ten years of cash flows. Where possible we use analyst estimates, but when these aren't available we extrapolate the previous free cash flow (FCF) from the last estimate or reported value. We assume companies with shrinking free cash flow will slow their rate of shrinkage, and that companies with growing free cash flow will see their growth rate slow, over this period. We do this to reflect that growth tends to slow more in the early years than it does in later years.
Generally we assume that a dollar today is more valuable than a dollar in the future, and so the sum of these future cash flows is then discounted to today's value:
10-year free cash flow (FCF) estimate
| 2026 | 2027 | 2028 | 2029 | 2030 | 2031 | 2032 | 2033 | 2034 | 2035 | |
| Levered FCF (¥, Millions) | JP¥12.1b | JP¥44.1b | JP¥52.6b | JP¥73.4b | JP¥83.5b | JP¥90.6b | JP¥96.2b | JP¥100.4b | JP¥103.7b | JP¥106.2b |
| Growth Rate Estimate Source | Analyst x5 | Analyst x4 | Analyst x7 | Analyst x3 | Analyst x3 | Est @ 8.50% | Est @ 6.11% | Est @ 4.43% | Est @ 3.26% | Est @ 2.44% |
| Present Value (¥, Millions) Discounted @ 7.5% | JP¥11.2k | JP¥38.2k | JP¥42.3k | JP¥55.0k | JP¥58.3k | JP¥58.8k | JP¥58.1k | JP¥56.5k | JP¥54.2k | JP¥51.7k |
("Est" = FCF growth rate estimated by Simply Wall St)
Present Value of 10-year Cash Flow (PVCF) = JP¥484b
After calculating the present value of future cash flows in the initial 10-year period, we need to calculate the Terminal Value, which accounts for all future cash flows beyond the first stage. For a number of reasons a very conservative growth rate is used that cannot exceed that of a country's GDP growth. In this case we have used the 5-year average of the 10-year government bond yield (0.5%) to estimate future growth. In the same way as with the 10-year 'growth' period, we discount future cash flows to today's value, using a cost of equity of 7.5%.
Terminal Value (TV)= FCF2035 × (1 + g) ÷ (r – g) = JP¥106b× (1 + 0.5%) ÷ (7.5%– 0.5%) = JP¥1.5t
Present Value of Terminal Value (PVTV)= TV / (1 + r)10= JP¥1.5t÷ ( 1 + 7.5%)10= JP¥748b
The total value is the sum of cash flows for the next ten years plus the discounted terminal value, which results in the Total Equity Value, which in this case is JP¥1.2t. The last step is to then divide the equity value by the number of shares outstanding. Compared to the current share price of JP¥9.7k, the company appears reasonably expensive at the time of writing. Valuations are imprecise instruments though, rather like a telescope - move a few degrees and end up in a different galaxy. Do keep this in mind.
The Assumptions
We would point out that the most important inputs to a discounted cash flow are the discount rate and of course the actual cash flows. You don't have to agree with these inputs, I recommend redoing the calculations yourself and playing with them. The DCF also does not consider the possible cyclicality of an industry, or a company's future capital requirements, so it does not give a full picture of a company's potential performance. Given that we are looking at Kawasaki Heavy Industries as potential shareholders, the cost of equity is used as the discount rate, rather than the cost of capital (or weighted average cost of capital, WACC) which accounts for debt. In this calculation we've used 7.5%, which is based on a levered beta of 1.324. Beta is a measure of a stock's volatility, compared to the market as a whole. We get our beta from the industry average beta of globally comparable companies, with an imposed limit between 0.8 and 2.0, which is a reasonable range for a stable business.
Check out our latest analysis for Kawasaki Heavy Industries
SWOT Analysis for Kawasaki Heavy Industries
Strength
- Earnings growth over the past year exceeded the industry.
- Debt is well covered by earnings.
Weakness
- Dividend is low compared to the top 25% of dividend payers in the Machinery market.
Opportunity
- Annual earnings are forecast to grow faster than the Japanese market.
- Good value based on P/E ratio compared to estimated Fair P/E ratio.
Threat
- Debt is not well covered by operating cash flow.
- Dividends are not covered by cash flow.
- Revenue is forecast to grow slower than 20% per year.
Moving On:
Valuation is only one side of the coin in terms of building your investment thesis, and it ideally won't be the sole piece of analysis you scrutinize for a company. The DCF model is not a perfect stock valuation tool. Instead the best use for a DCF model is to test certain assumptions and theories to see if they would lead to the company being undervalued or overvalued. If a company grows at a different rate, or if its cost of equity or risk free rate changes sharply, the output can look very different. Why is the intrinsic value lower than the current share price? For Kawasaki Heavy Industries, we've compiled three further factors you should further examine:
- Risks: For example, we've discovered 2 warning signs for Kawasaki Heavy Industries (1 is a bit unpleasant!) that you should be aware of before investing here.
- Future Earnings: How does 7012's growth rate compare to its peers and the wider market? Dig deeper into the analyst consensus number for the upcoming years by interacting with our free analyst growth expectation chart.
- Other Solid Businesses: Low debt, high returns on equity and good past performance are fundamental to a strong business. Why not explore our interactive list of stocks with solid business fundamentals to see if there are other companies you may not have considered!
PS. The Simply Wall St app conducts a discounted cash flow valuation for every stock on the TSE every day. If you want to find the calculation for other stocks just search here.
Valuation is complex, but we're here to simplify it.
Discover if Kawasaki Heavy Industries might be undervalued or overvalued with our detailed analysis, featuring fair value estimates, potential risks, dividends, insider trades, and its financial condition.
Access Free AnalysisHave feedback on this article? Concerned about the content? Get in touch with us directly. Alternatively, email editorial-team (at) simplywallst.com.
This article by Simply Wall St is general in nature. We provide commentary based on historical data and analyst forecasts only using an unbiased methodology and our articles are not intended to be financial advice. It does not constitute a recommendation to buy or sell any stock, and does not take account of your objectives, or your financial situation. We aim to bring you long-term focused analysis driven by fundamental data. Note that our analysis may not factor in the latest price-sensitive company announcements or qualitative material. Simply Wall St has no position in any stocks mentioned.
About TSE:7012
Kawasaki Heavy Industries
Engages in aerospace systems, vehicles, energy solutions and marine, precision machinery, and robot businesses in Japan and internationally.
Solid track record with adequate balance sheet.
Similar Companies
Market Insights

Advertisement
Community Narratives
The "Molecular Pencil": Why Beam's Technology is Built to Win
Fair Value US$65.01|65.4% undervalued
DA
Community Contributor
The silent giant behind virtually every advanced chip powering AI, smartphones, and modern infrastructure.
Fair Value US$310.00|6.1% undervalued
OS
Community Contributor
ADP Stock: Solid Fundamentals, But AI Investments Test Its Margin Resilience
Fair Value US$387.77|34.2% undervalued
YI
Community Contributor
MINISO's fair value is projected at 26.69 with an anticipated PE ratio shift of 20x
Fair Value US$24.03|9.6% undervalued
BE
Community Contributor