
Advertisement
Seibu Electric & Machinery's (TSE:6144) Earnings Are Weaker Than They Seem
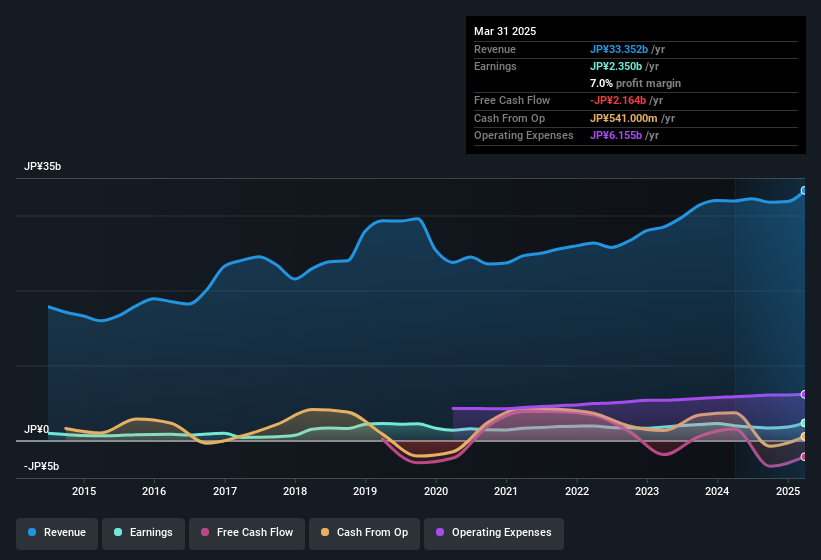
Despite posting some strong earnings, the market for Seibu Electric & Machinery Co., Ltd.'s (TSE:6144) stock hasn't moved much. Our analysis suggests that shareholders have noticed something concerning in the numbers.
Examining Cashflow Against Seibu Electric & Machinery's Earnings
In high finance, the key ratio used to measure how well a company converts reported profits into free cash flow (FCF) is the accrual ratio (from cashflow). To get the accrual ratio we first subtract FCF from profit for a period, and then divide that number by the average operating assets for the period. The ratio shows us how much a company's profit exceeds its FCF.
As a result, a negative accrual ratio is a positive for the company, and a positive accrual ratio is a negative. That is not intended to imply we should worry about a positive accrual ratio, but it's worth noting where the accrual ratio is rather high. That's because some academic studies have suggested that high accruals ratios tend to lead to lower profit or less profit growth.
Over the twelve months to March 2025, Seibu Electric & Machinery recorded an accrual ratio of 0.22. We can therefore deduce that its free cash flow fell well short of covering its statutory profit. In the last twelve months it actually had negative free cash flow, with an outflow of JP¥2.2b despite its profit of JP¥2.35b, mentioned above. We saw that FCF was JP¥1.5b a year ago though, so Seibu Electric & Machinery has at least been able to generate positive FCF in the past.
Note: we always recommend investors check balance sheet strength. Click here to be taken to our balance sheet analysis of Seibu Electric & Machinery.
Our Take On Seibu Electric & Machinery's Profit Performance
Seibu Electric & Machinery's accrual ratio for the last twelve months signifies cash conversion is less than ideal, which is a negative when it comes to our view of its earnings. Because of this, we think that it may be that Seibu Electric & Machinery's statutory profits are better than its underlying earnings power. But at least holders can take some solace from the 21% per annum growth in EPS for the last three. At the end of the day, it's essential to consider more than just the factors above, if you want to understand the company properly. Keep in mind, when it comes to analysing a stock it's worth noting the risks involved. To that end, you should learn about the 2 warning signs we've spotted with Seibu Electric & Machinery (including 1 which is significant).
Today we've zoomed in on a single data point to better understand the nature of Seibu Electric & Machinery's profit. But there is always more to discover if you are capable of focussing your mind on minutiae. For example, many people consider a high return on equity as an indication of favorable business economics, while others like to 'follow the money' and search out stocks that insiders are buying. So you may wish to see this free collection of companies boasting high return on equity, or this list of stocks with high insider ownership.
New: Manage All Your Stock Portfolios in One Place
We've created the ultimate portfolio companion for stock investors, and it's free.
• Connect an unlimited number of Portfolios and see your total in one currency
• Be alerted to new Warning Signs or Risks via email or mobile
• Track the Fair Value of your stocks
Have feedback on this article? Concerned about the content? Get in touch with us directly. Alternatively, email editorial-team (at) simplywallst.com.
This article by Simply Wall St is general in nature. We provide commentary based on historical data and analyst forecasts only using an unbiased methodology and our articles are not intended to be financial advice. It does not constitute a recommendation to buy or sell any stock, and does not take account of your objectives, or your financial situation. We aim to bring you long-term focused analysis driven by fundamental data. Note that our analysis may not factor in the latest price-sensitive company announcements or qualitative material. Simply Wall St has no position in any stocks mentioned.
About TSE:6144
Flawless balance sheet with solid track record and pays a dividend.
Market Insights

Advertisement
Community Narratives
The company that turned a verb into a global necessity and basically runs the modern internet, digital ads, smartphones, maps, and AI.
Fair Value US$300.00|6.3% undervalued
OS
Community Contributor
Flowers Foods Pays A Fair Price For Health
Fair Value US$16.12|26.0% undervalued
NV
Community Contributor
TMX Group will thrive with 33.3% profit margin and enduring market moat
Fair Value CA$49.90|3.7% overvalued
LI
Community Contributor