Advertisement
What Do Okuma’s Shares Signal After Recent Factory Automation Orders Surge?

Simply Wall St
Reviewed by Bailey Pemberton
Thinking about what to do with Okuma stock right now? You are not alone. Whether you are considering starting a new position or simply wondering if it is time to hold or exit, Okuma’s recent performance has likely caught your eye. Over the last year, shares are up 9.0%, riding on years of steady gains, with the stock climbing 38.4% in three years and an impressive 48.0% over five years. Those long-term numbers may look appealing, but you have probably also noticed some short-term bumps. The stock is down 4.0% in the past week and edging lower by 2.3% over the past month. This kind of movement often reflects more than just routine investor jitters, hinting at shifts in how the market is assessing Okuma’s growth prospects or risk profile, especially amidst recent changes in sector outlooks and broader market developments.
For investors focused on finding value, here is where things get interesting. Okuma has a valuation score of 2 out of 6, meaning it is considered undervalued by two standard checks. This is nothing spectacular, but also not overly pricey at current levels. However, before you jump to any conclusions, let’s explore exactly what those valuation checks are and how useful they truly are for investors like you. Stay tuned, because after taking a closer look at these typical valuation methods, we will also consider a more nuanced and potentially smarter way to evaluate Okuma’s market position that could change your perspective.
Okuma scores just 2/6 on our valuation checks. See what other red flags we found in the full valuation breakdown.
Approach 1: Okuma Discounted Cash Flow (DCF) Analysis
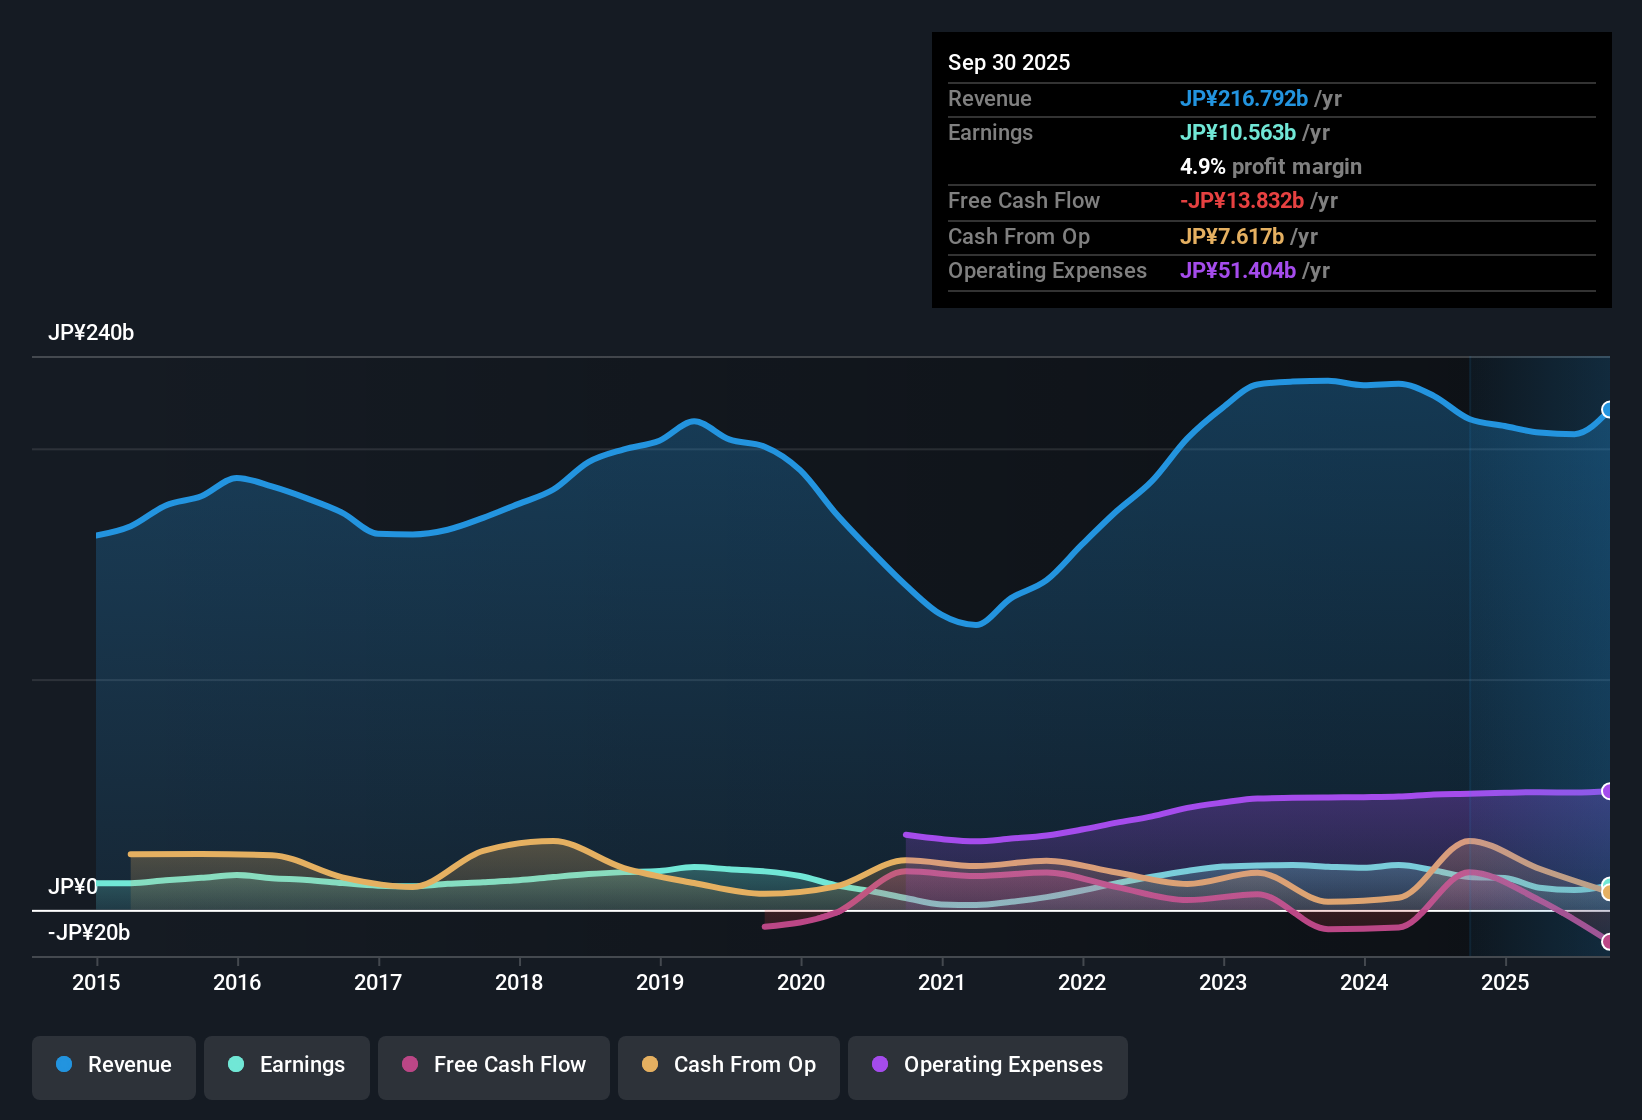
The Discounted Cash Flow (DCF) model projects a company’s future cash flows and then discounts them back to today's value, giving investors a sense of what the business is intrinsically worth right now. For Okuma, this means examining its current and expected free cash flow (FCF) over the coming years in yen.
Currently, Okuma reports ¥6.6 billion in free cash flow. Analyst estimates see this figure rising steadily over the next five years, reaching ¥26.7 billion by 2030. After that, projections are extrapolated based on recent trends, as direct analyst coverage becomes less certain. All cash flow projections are reflected in billions of yen, providing a clear picture of Okuma’s trajectory.
Using these projections and discounting them appropriately, the DCF approach calculates an intrinsic value for Okuma of ¥8,114 per share. With the current market price showing a discount of 58.8 percent, this analysis suggests the stock is meaningfully undervalued based on its future cash-generating ability.
Result: UNDERVALUED
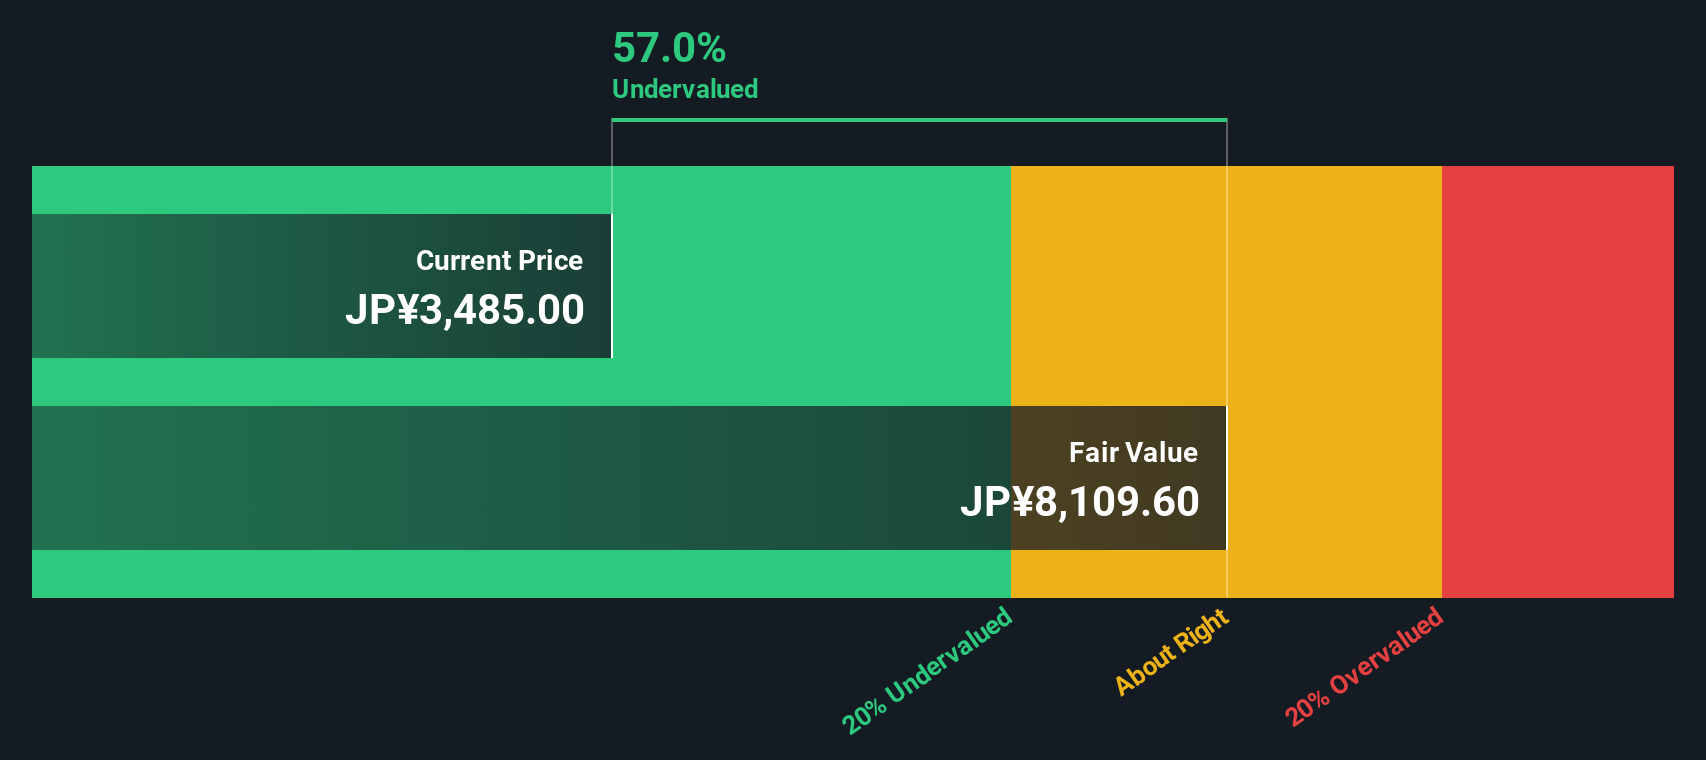
Our Discounted Cash Flow (DCF) analysis suggests Okuma is undervalued by 58.8%. Track this in your watchlist or portfolio, or discover more undervalued stocks.
Approach 2: Okuma Price vs Earnings
The price-to-earnings (PE) ratio is a widely used metric for valuing profitable companies like Okuma because it directly links a company's earnings to its market price. In other words, it tells you how much investors are willing to pay for each yen of earnings, serving as a quick gauge of market sentiment toward a company's profitability.
However, not all PE ratios are created equal. Companies with higher expected growth, better margins, or lower risk tend to command higher PE ratios, while those facing more uncertainty or slower growth often trade at lower multiples. This makes it important to look beyond the headline number and consider what is actually driving Okuma's valuation.
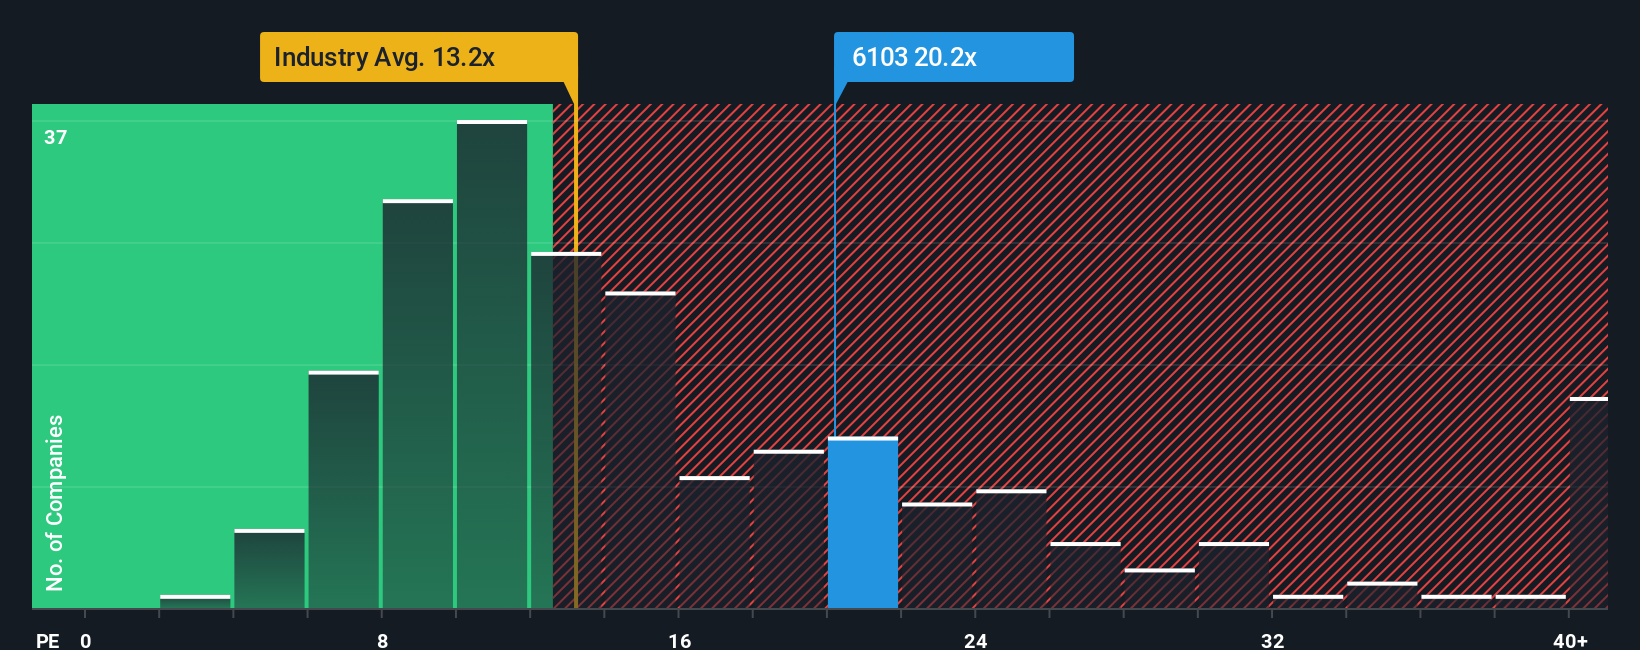
Currently, Okuma's PE ratio sits at 23.6x. For comparison, the average PE ratio across the Machinery industry is 13.2x, and Okuma’s peer group averages 16.2x. That suggests the market is assigning Okuma a premium, likely factoring in its steady long-term performance and earnings outlook.
This is where Simply Wall St’s proprietary “Fair Ratio” comes in. The Fair Ratio is a refined benchmark that reflects Okuma's specific circumstances, including its growth forecast, margins, risk factors, and market cap, rather than relying solely on broad industry or peer numbers. For Okuma, the Fair Ratio is 20.4x, which accounts for the nuances that peers and industry averages may miss.
Comparing Okuma’s actual PE ratio (23.6x) to its Fair Ratio (20.4x) shows that the stock is valued a bit higher than what would be considered fair, according to these more detailed criteria. That suggests Okuma is slightly overvalued based on earnings multiples, but not drastically so given its strong fundamentals and sector position.
Result: OVERVALUED
PE ratios tell one story, but what if the real opportunity lies elsewhere? Discover companies where insiders are betting big on explosive growth.
Upgrade Your Decision Making: Choose your Okuma Narrative
Earlier we mentioned there is an even better way to understand valuation. Let’s introduce you to Narratives. A Narrative is your unique perspective on a company: it is the story you believe in, translated into concrete financial expectations, like future revenues, profit margins, and fair value. Narratives bridge the gap between how you interpret Okuma’s journey and what those beliefs mean for its share price, making it much easier to act on your own insights rather than just follow general numbers.
Available on Simply Wall St’s Community page and used by millions of investors, Narratives are simple to create and instantly actionable. By connecting your projected story with up-to-date forecasts, they show your personalized Fair Value next to the current Price, helping you decide if now is the right time to buy, hold, or sell. Furthermore, Narratives automatically update as new data or company news arrives, so your outlook stays as current as the market.
For Okuma, this means one investor might forecast a high fair value if they expect market-leading growth, while another takes a much lower stance if they see industry headwinds. Both are valid and visible as part of the dynamic investing conversation.
Do you think there's more to the story for Okuma? Create your own Narrative to let the Community know!
This article by Simply Wall St is general in nature. We provide commentary based on historical data and analyst forecasts only using an unbiased methodology and our articles are not intended to be financial advice. It does not constitute a recommendation to buy or sell any stock, and does not take account of your objectives, or your financial situation. We aim to bring you long-term focused analysis driven by fundamental data. Note that our analysis may not factor in the latest price-sensitive company announcements or qualitative material. Simply Wall St has no position in any stocks mentioned.
New: AI Stock Screener & Alerts
Our new AI Stock Screener scans the market every day to uncover opportunities.
• Dividend Powerhouses (3%+ Yield)
• Undervalued Small Caps with Insider Buying
• High growth Tech and AI Companies
Or build your own from over 50 metrics.
Have feedback on this article? Concerned about the content? Get in touch with us directly. Alternatively, email editorial-team@simplywallst.com
About TSE:6103
Okuma
Manufactures and sells machine tools in Japan, the United States, Europe, and Asia/Pacific.
Excellent balance sheet second-rate dividend payer.
Similar Companies
Market Insights

Advertisement
Community Narratives
The "Molecular Pencil": Why Beam's Technology is Built to Win
Fair Value US$65.01|65.4% undervalued
DA
Community Contributor
The silent giant behind virtually every advanced chip powering AI, smartphones, and modern infrastructure.
Fair Value US$310.00|6.1% undervalued
OS
Community Contributor
ADP Stock: Solid Fundamentals, But AI Investments Test Its Margin Resilience
Fair Value US$387.77|34.2% undervalued
YI
Community Contributor
MINISO's fair value is projected at 26.69 with an anticipated PE ratio shift of 20x
Fair Value US$24.03|9.6% undervalued
BE
Community Contributor