Advertisement
Mazda (TSE:7261) Valuation in Focus as New Tech-Driven Concepts Signal Strategic Shift

Simply Wall St
Reviewed by Simply Wall St
Mazda Motor (TSE:7261) has revealed two forward-looking concept vehicles, each spotlighting innovative technology and sustainability. Both models highlight the company’s commitment to next-generation mobility and could influence how investors view Mazda’s future prospects.
See our latest analysis for Mazda Motor.
Shares of Mazda Motor have gained momentum in recent months, with a 7.2% rise over the past week and an impressive 15.9% share price return in the last 90 days. This builds on a steady long-term record, as total shareholder return over five years has reached 107%. Recent unveilings of forward-thinking concept vehicles and ongoing dividend discussions at board level further reinforce the sense that Mazda is actively shaping its future and rewarding investors along the way.
If news of Mazda’s next-generation models has you curious about innovation across the sector, take the next step and discover See the full list for free.
With Mazda’s share price advancing and new concepts on display, investors are left to consider whether recent gains reflect the company’s innovation and strong results, or if there is still value left to unlock in the stock.
Price-to-Earnings of 21.4x: Is it justified?
Mazda Motor currently trades on a price-to-earnings (P/E) ratio of 21.4x, which is significantly higher than both its peer group and the broader Asian auto industry. With a last close of ¥1,133.5, the stock’s premium valuation stands out sharply against direct competitors.
The price-to-earnings ratio measures what the market is willing to pay today for a company's expected future earnings. In the auto sector, it is a vital metric, reflecting not just profitability but also market confidence in future growth or stability. When a company’s P/E is notably higher than the industry average, it often signals optimistic expectations or premium brand positioning. However, it can also suggest the market may be overestimating its future profits.
Compared to the Asian auto sector’s average P/E of 18.9x and peer average of 12x, Mazda Motor appears expensive. The company’s P/E is also well below the estimated fair P/E ratio of 28.6x, which creates tension between market caution and the level that some models suggest the stock could justify if performance or sentiment improves.
Explore the SWS fair ratio for Mazda Motor
Result: Price-to-Earnings of 21.4x (OVERVALUED)
However, sluggish revenue growth and a slight discount to analyst price targets could challenge Mazda’s current premium and limit its future upside potential in the near term.
Find out about the key risks to this Mazda Motor narrative.
Another View: Discounted Cash Flow Perspective
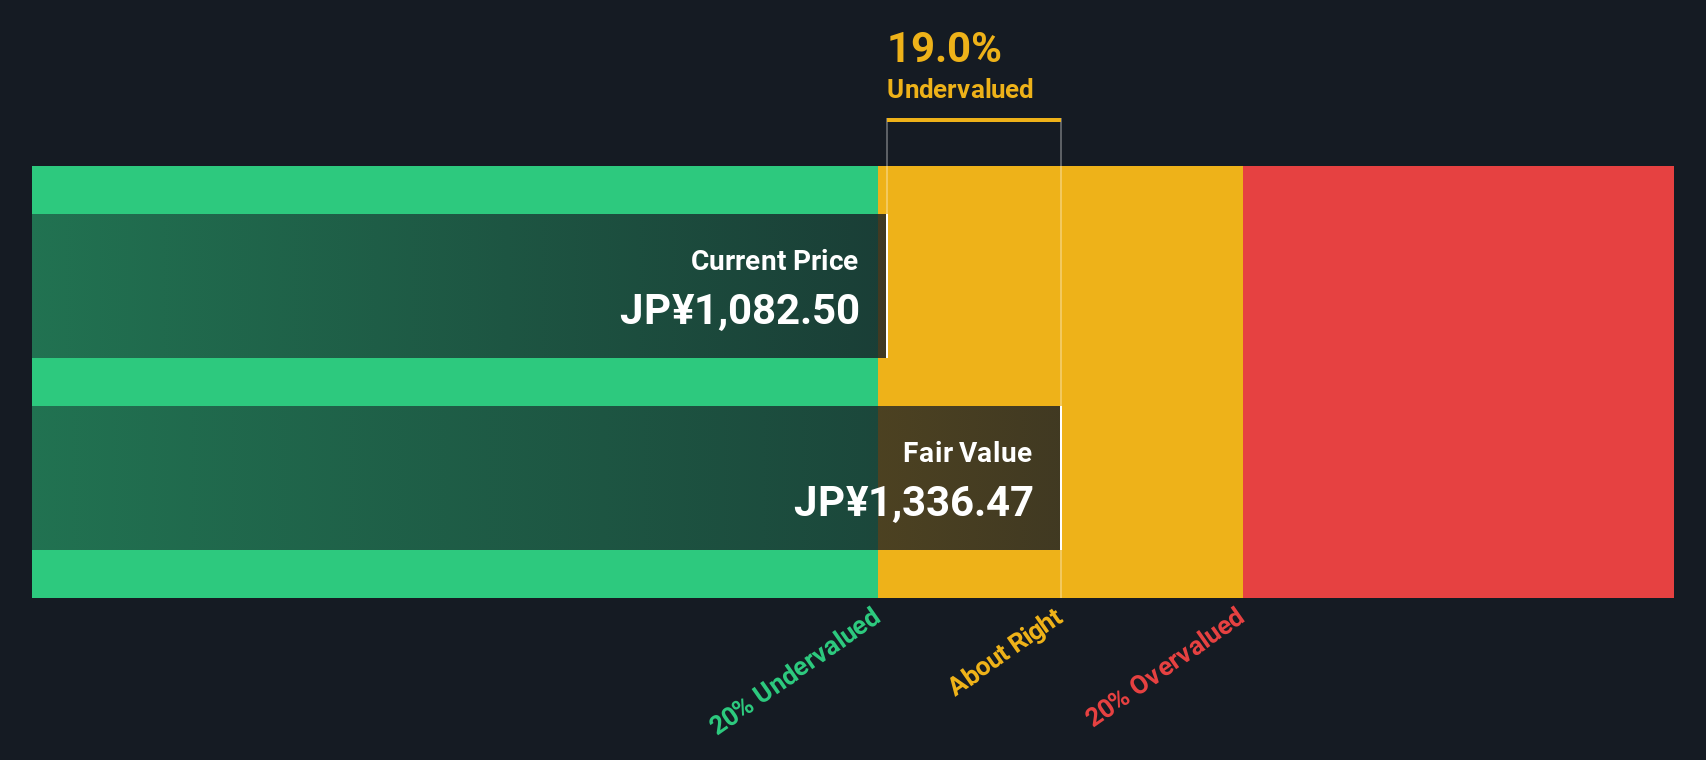
While the price-to-earnings ratio suggests Mazda Motor is trading at a premium compared to industry and peers, our DCF model offers a different angle. The SWS DCF model estimates that shares are actually around 4.7% below their fair value, which hints at potential undervaluation. Could the market be overlooking Mazda’s long-term cash flow potential?
Look into how the SWS DCF model arrives at its fair value.
Simply Wall St performs a discounted cash flow (DCF) on every stock in the world every day (check out Mazda Motor for example). We show the entire calculation in full. You can track the result in your watchlist or portfolio and be alerted when this changes, or use our stock screener to discover 872 undervalued stocks based on their cash flows. If you save a screener we even alert you when new companies match - so you never miss a potential opportunity.
Build Your Own Mazda Motor Narrative
If you’d rather interpret Mazda’s outlook independently or take a closer look at the numbers, creating your own perspective is simple and only takes a few minutes. So why not Do it your way
A great starting point for your Mazda Motor research is our analysis highlighting 2 key rewards and 4 important warning signs that could impact your investment decision.
Looking for more investment ideas?
Don’t let great opportunities pass by. Supercharge your portfolio by checking out unique stocks and trends spotted by Simply Wall Street’s powerful Screeners.
- Unlock access to potential high-flyers and see which companies are breaking through with these 3564 penny stocks with strong financials right now.
- Maximize your yields by targeting cash-generating businesses via these 15 dividend stocks with yields > 3% delivering attractive returns above 3%.
- Tap into the future of medicine and technology with these 32 healthcare AI stocks making waves in AI-driven healthcare innovation.
This article by Simply Wall St is general in nature. We provide commentary based on historical data and analyst forecasts only using an unbiased methodology and our articles are not intended to be financial advice. It does not constitute a recommendation to buy or sell any stock, and does not take account of your objectives, or your financial situation. We aim to bring you long-term focused analysis driven by fundamental data. Note that our analysis may not factor in the latest price-sensitive company announcements or qualitative material. Simply Wall St has no position in any stocks mentioned.
New: Manage All Your Stock Portfolios in One Place
We've created the ultimate portfolio companion for stock investors, and it's free.
• Connect an unlimited number of Portfolios and see your total in one currency
• Be alerted to new Warning Signs or Risks via email or mobile
• Track the Fair Value of your stocks
Have feedback on this article? Concerned about the content? Get in touch with us directly. Alternatively, email editorial-team@simplywallst.com
About TSE:7261
Mazda Motor
Engages in the manufacture and sale of passenger cars and commercial vehicles in Japan, North America, Europe, and internationally.
Excellent balance sheet with slight risk.
Similar Companies
Market Insights

Advertisement
Community Narratives
The "Molecular Pencil": Why Beam's Technology is Built to Win
Fair Value US$65.01|65.4% undervalued
DA
Community Contributor
The silent giant behind virtually every advanced chip powering AI, smartphones, and modern infrastructure.
Fair Value US$310.00|6.1% undervalued
OS
Community Contributor
ADP Stock: Solid Fundamentals, But AI Investments Test Its Margin Resilience
Fair Value US$387.77|34.2% undervalued
YI
Community Contributor
MINISO's fair value is projected at 26.69 with an anticipated PE ratio shift of 20x
Fair Value US$24.03|9.6% undervalued
BE
Community Contributor