- India
- /
- Metals and Mining
- /
- NSEI:VEDL
Top 3 Indian Stocks Estimated To Be Undervalued In September 2024

Reviewed by Simply Wall St

The Indian market is up 1.3% over the last week and has seen a remarkable 45% increase over the past 12 months, with earnings forecasted to grow by 17% annually. In this thriving environment, identifying undervalued stocks can be crucial for investors seeking to capitalize on potential growth opportunities while mitigating risks.
Top 10 Undervalued Stocks Based On Cash Flows In India
| Name | Current Price | Fair Value (Est) | Discount (Est) |
| Everest Kanto Cylinder (NSEI:EKC) | ₹193.74 | ₹306.27 | 36.7% |
| Apollo Pipes (BSE:531761) | ₹592.70 | ₹1138.04 | 47.9% |
| Titagarh Rail Systems (NSEI:TITAGARH) | ₹1276.25 | ₹2156.77 | 40.8% |
| Vedanta (NSEI:VEDL) | ₹479.85 | ₹929.85 | 48.4% |
| Patel Engineering (BSE:531120) | ₹58.28 | ₹93.37 | 37.6% |
| IOL Chemicals and Pharmaceuticals (BSE:524164) | ₹492.20 | ₹762.32 | 35.4% |
| Prataap Snacks (NSEI:DIAMONDYD) | ₹888.85 | ₹1509.79 | 41.1% |
| Orchid Pharma (NSEI:ORCHPHARMA) | ₹1383.00 | ₹2142.32 | 35.4% |
| Tarsons Products (NSEI:TARSONS) | ₹452.65 | ₹708.43 | 36.1% |
| Artemis Medicare Services (NSEI:ARTEMISMED) | ₹285.95 | ₹445.15 | 35.8% |
Here's a peek at a few of the choices from the screener.
HIL (NSEI:HIL)
Overview: HIL Limited produces and distributes building materials and other solutions in India and internationally, with a market cap of ₹22.31 billion.
Operations: The company's revenue segments include Polymer Solutions (₹6.10 billion), Roofing Solutions (₹11.44 billion), Building Solutions (₹5.46 billion), and Flooring Solutions (₹11.63 billion).
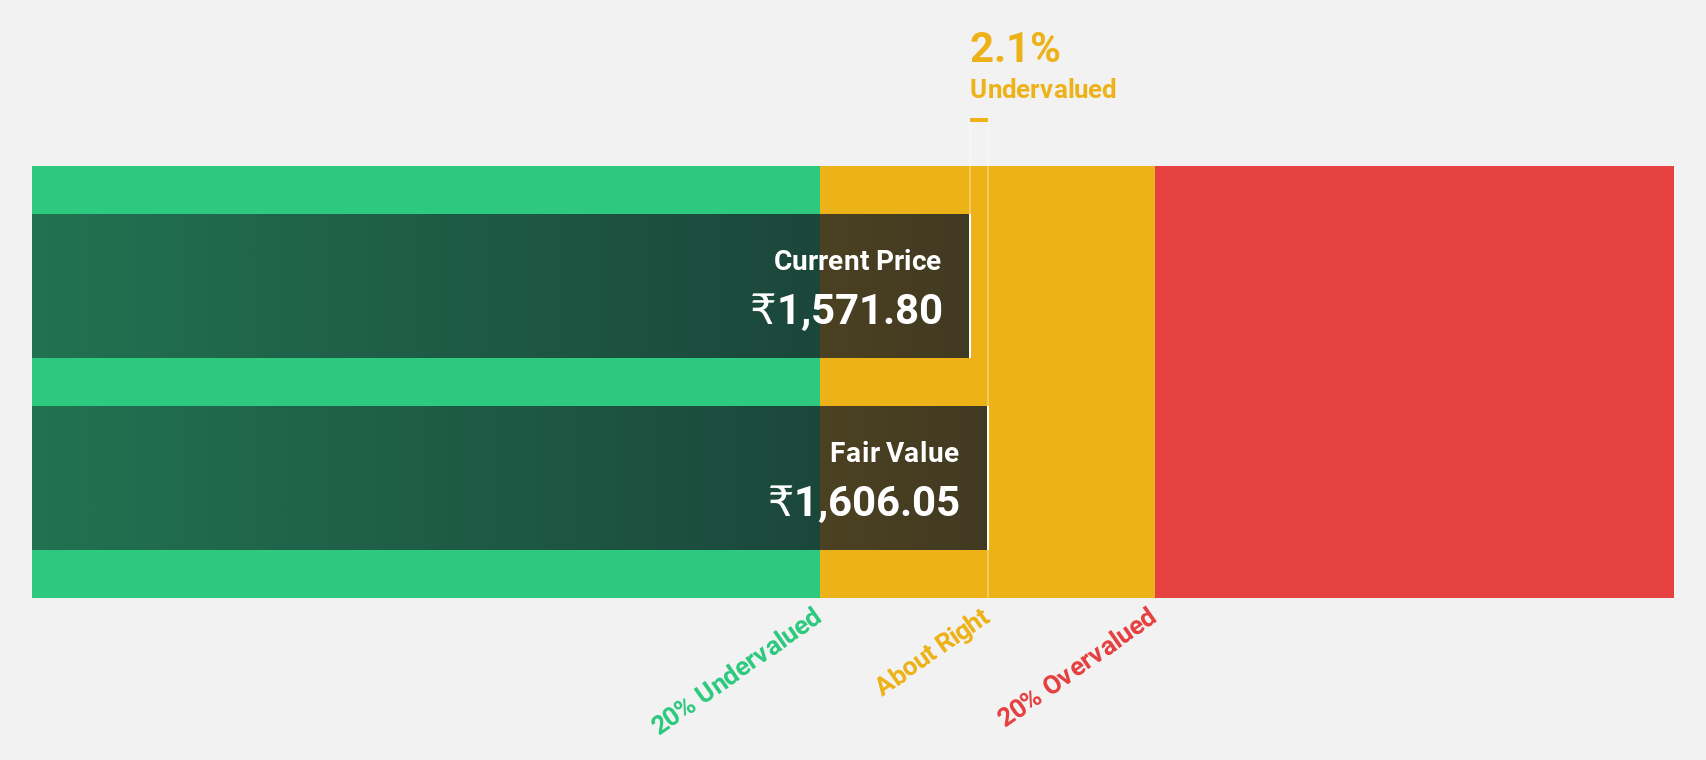
Estimated Discount To Fair Value: 16.7%
HIL (₹2958.95) is trading at 16.7% below its estimated fair value of ₹3551.65, indicating it may be undervalued based on cash flows. Despite a recent decline in net income from ₹578.6 million to ₹126.2 million for Q1 2025, the company shows potential with forecasted earnings growth of 170.76% per year and expected profitability within three years, outperforming the average market growth rate in India (10.1%).
- Our earnings growth report unveils the potential for significant increases in HIL's future results.
- Unlock comprehensive insights into our analysis of HIL stock in this financial health report.
Krsnaa Diagnostics (NSEI:KRSNAA)
Overview: Krsnaa Diagnostics Limited provides diagnostic services in India and has a market cap of ₹27.07 billion.
Operations: Radiology and Pathology Services generated ₹6.50 billion in revenue for Krsnaa Diagnostics Limited.
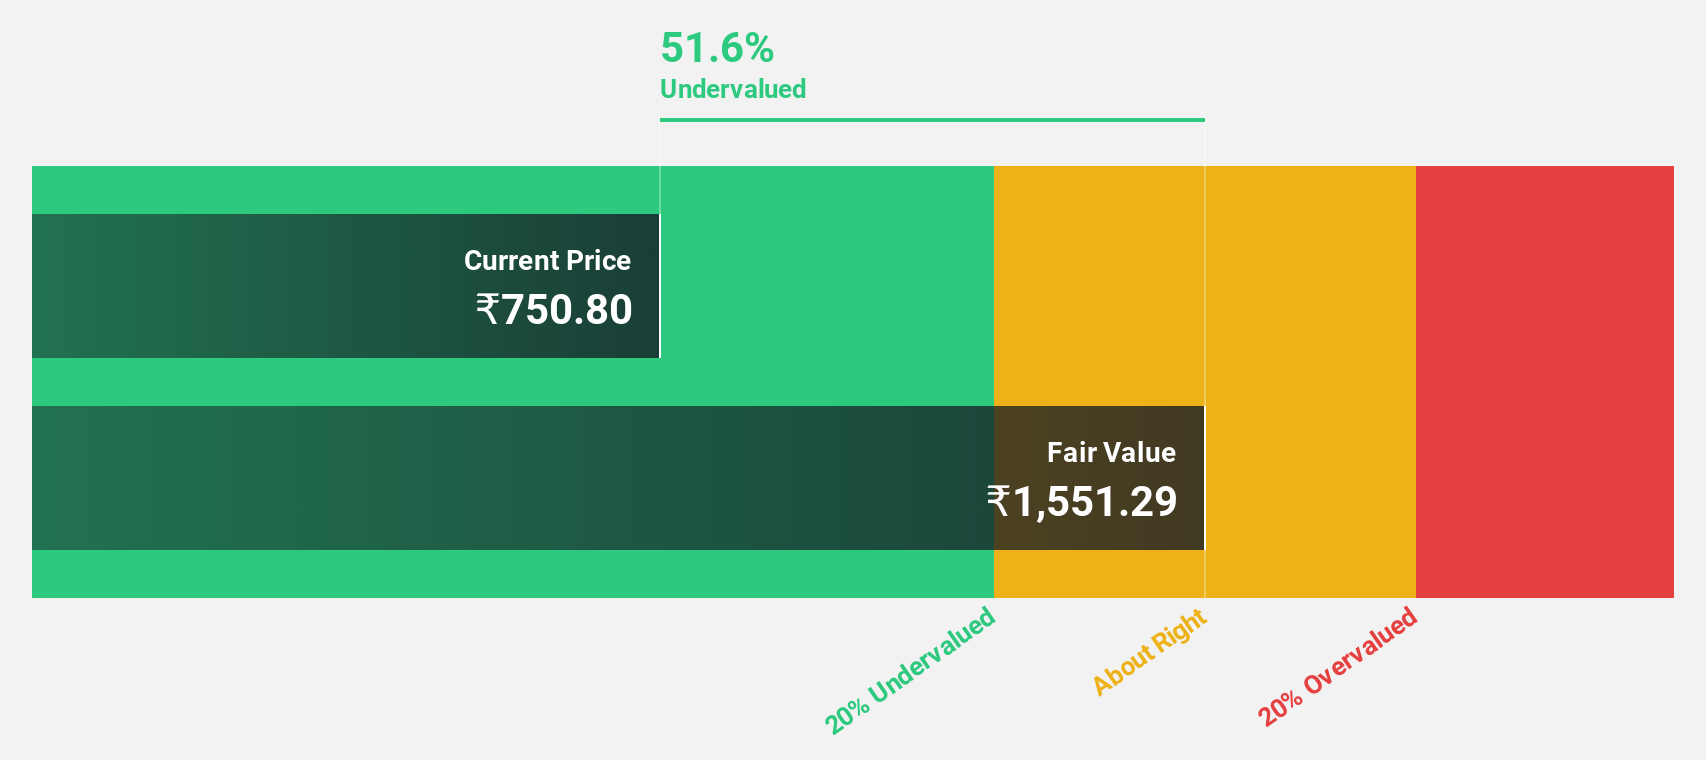
Estimated Discount To Fair Value: 28.1%
Krsnaa Diagnostics (₹838.2) is trading at 28.1% below its estimated fair value of ₹1165.33, suggesting it may be undervalued based on cash flows. The company’s earnings are forecast to grow significantly at 36.9% per year, outpacing the Indian market's average growth rate of 17.3%. However, shareholders have experienced dilution in the past year and its low dividend yield of 0.3% is not well covered by free cash flows.
- Our expertly prepared growth report on Krsnaa Diagnostics implies its future financial outlook may be stronger than recent results.
- Click here to discover the nuances of Krsnaa Diagnostics with our detailed financial health report.
Vedanta (NSEI:VEDL)
Overview: Vedanta Limited, a diversified natural resources company with a market cap of ₹1.87 trillion, explores, extracts, and processes minerals and oil and gas across India and internationally.
Operations: Vedanta Limited generates revenue from various segments including Power (₹62.54 billion), Copper (₹197.31 billion), Iron Ore (₹83.51 billion), Aluminium (₹499.81 billion), Oil and Gas (₹179.05 billion), and Zinc - International (₹32.06 billion).
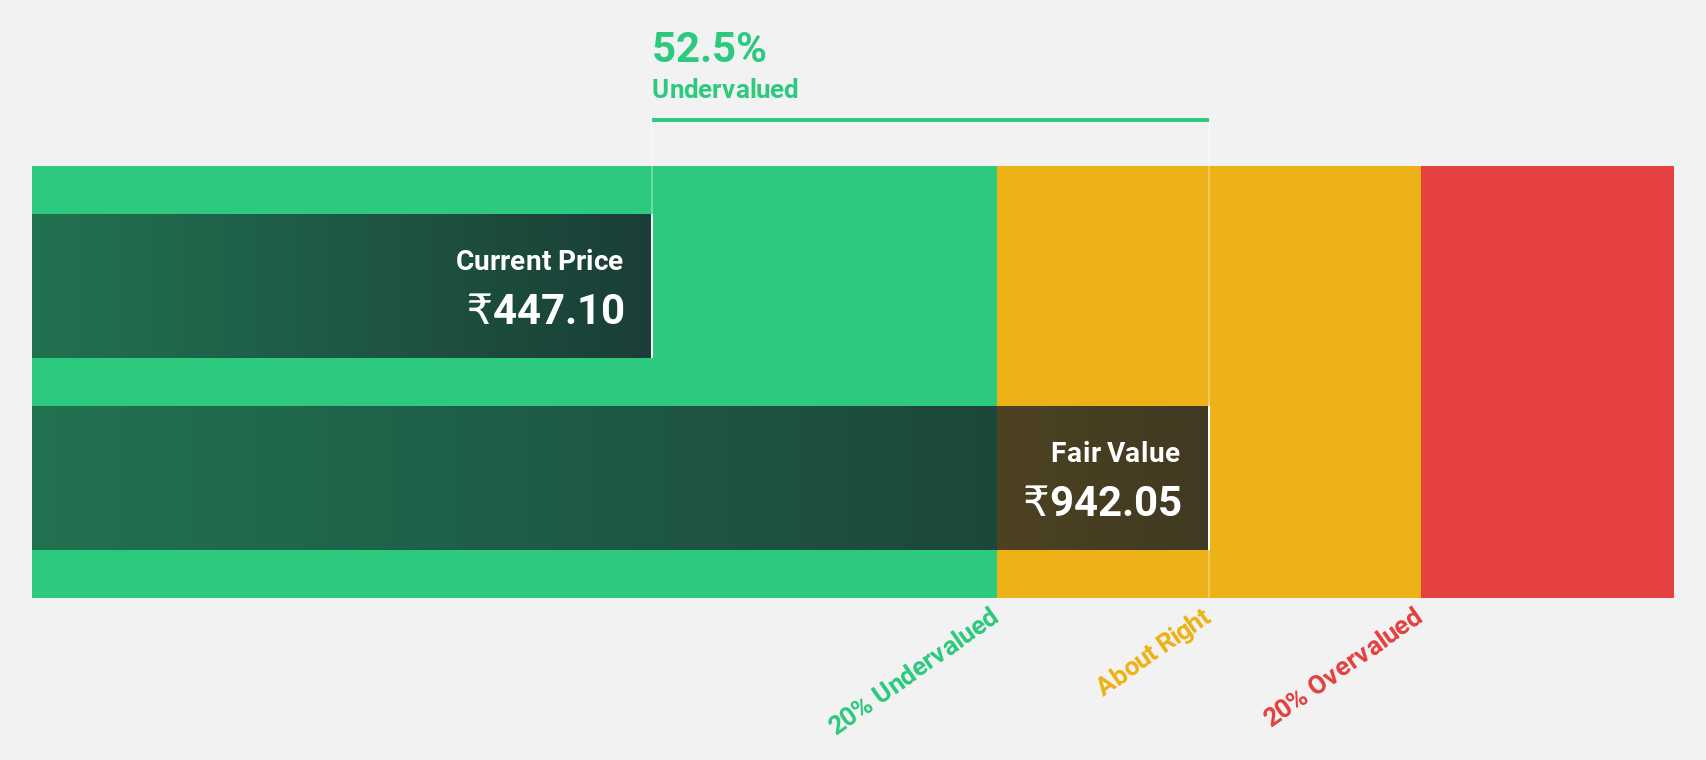
Estimated Discount To Fair Value: 48.4%
Vedanta (₹479.85) is trading at 48.4% below its estimated fair value of ₹929.85, indicating significant undervaluation based on cash flows despite high debt levels and recent shareholder dilution. The company's earnings are forecast to grow substantially at 41.84% per year, outpacing the Indian market's average growth rate of 17.3%. However, profit margins have declined from 6.2% to 3.6%, and the dividend yield of 3.13% is not well covered by earnings.
- Our comprehensive growth report raises the possibility that Vedanta is poised for substantial financial growth.
- Click here and access our complete balance sheet health report to understand the dynamics of Vedanta.
Where To Now?
- Unlock more gems! Our Undervalued Indian Stocks Based On Cash Flows screener has unearthed 22 more companies for you to explore.Click here to unveil our expertly curated list of 25 Undervalued Indian Stocks Based On Cash Flows.
- Invested in any of these stocks? Simplify your portfolio management with Simply Wall St and stay ahead with our alerts for any critical updates on your stocks.
- Unlock the power of informed investing with Simply Wall St, your free guide to navigating stock markets worldwide.
Contemplating Other Strategies?
- Explore high-performing small cap companies that haven't yet garnered significant analyst attention.
- Diversify your portfolio with solid dividend payers offering reliable income streams to weather potential market turbulence.
- Fuel your portfolio with companies showing strong growth potential, backed by optimistic outlooks both from analysts and management.
This article by Simply Wall St is general in nature. We provide commentary based on historical data and analyst forecasts only using an unbiased methodology and our articles are not intended to be financial advice. It does not constitute a recommendation to buy or sell any stock, and does not take account of your objectives, or your financial situation. We aim to bring you long-term focused analysis driven by fundamental data. Note that our analysis may not factor in the latest price-sensitive company announcements or qualitative material. Simply Wall St has no position in any stocks mentioned.
New: Manage All Your Stock Portfolios in One Place
We've created the ultimate portfolio companion for stock investors, and it's free.
• Connect an unlimited number of Portfolios and see your total in one currency
• Be alerted to new Warning Signs or Risks via email or mobile
• Track the Fair Value of your stocks
Have feedback on this article? Concerned about the content? Get in touch with us directly. Alternatively, email editorial-team@simplywallst.com
About NSEI:VEDL
Vedanta
A diversified natural resources company, explores, extracts, and processes minerals, and oil and gas in India, Europe, China, the United States, Mexico, and internationally.
Reasonable growth potential average dividend payer.

