
Advertisement
Is Tamilnadu Petroproducts Limited's (NSE:TNPETRO) Stock Price Struggling As A Result Of Its Mixed Financials?
Tamilnadu Petroproducts (NSE:TNPETRO) has had a rough week with its share price down 10%. It seems that the market might have completely ignored the positive aspects of the company's fundamentals and decided to weigh-in more on the negative aspects. Stock prices are usually driven by a company’s financial performance over the long term, and therefore we decided to pay more attention to the company's financial performance. Particularly, we will be paying attention to Tamilnadu Petroproducts' ROE today.
Return on equity or ROE is a key measure used to assess how efficiently a company's management is utilizing the company's capital. Simply put, it is used to assess the profitability of a company in relation to its equity capital.
How To Calculate Return On Equity?
ROE can be calculated by using the formula:
Return on Equity = Net Profit (from continuing operations) ÷ Shareholders' Equity
So, based on the above formula, the ROE for Tamilnadu Petroproducts is:
8.6% = ₹786m ÷ ₹9.1b (Based on the trailing twelve months to June 2025).
The 'return' is the income the business earned over the last year. One way to conceptualize this is that for each ₹1 of shareholders' capital it has, the company made ₹0.09 in profit.
View our latest analysis for Tamilnadu Petroproducts
What Has ROE Got To Do With Earnings Growth?
So far, we've learned that ROE is a measure of a company's profitability. We now need to evaluate how much profit the company reinvests or "retains" for future growth which then gives us an idea about the growth potential of the company. Assuming all else is equal, companies that have both a higher return on equity and higher profit retention are usually the ones that have a higher growth rate when compared to companies that don't have the same features.
A Side By Side comparison of Tamilnadu Petroproducts' Earnings Growth And 8.6% ROE
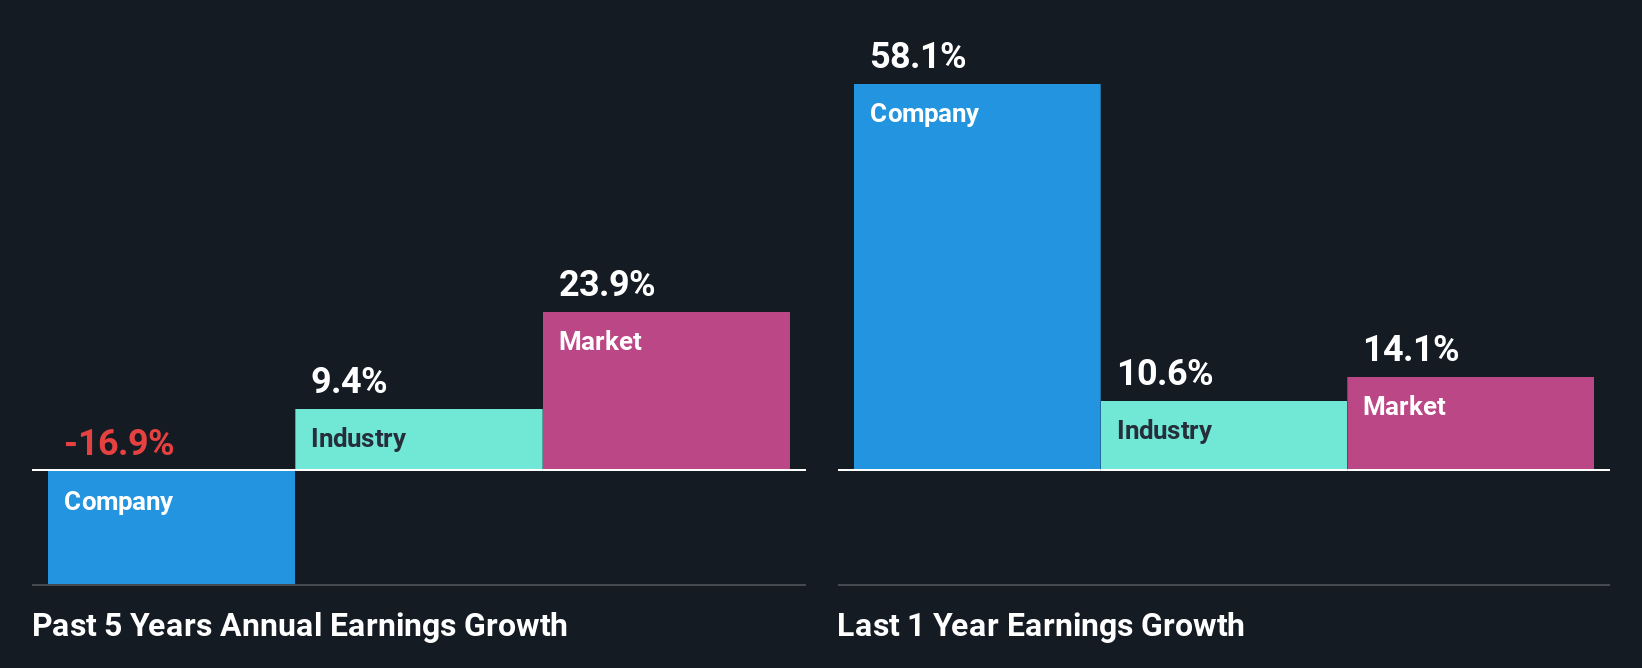
It is quite clear that Tamilnadu Petroproducts' ROE is rather low. A comparison with the industry shows that the company's ROE is pretty similar to the average industry ROE of 9.9%. Therefore, it might not be wrong to say that the five year net income decline of 17% seen by Tamilnadu Petroproducts was possibly a result of the disappointing ROE.
So, as a next step, we compared Tamilnadu Petroproducts' performance against the industry and were disappointed to discover that while the company has been shrinking its earnings, the industry has been growing its earnings at a rate of 9.4% over the last few years.
Earnings growth is a huge factor in stock valuation. The investor should try to establish if the expected growth or decline in earnings, whichever the case may be, is priced in. Doing so will help them establish if the stock's future looks promising or ominous. If you're wondering about Tamilnadu Petroproducts''s valuation, check out this gauge of its price-to-earnings ratio, as compared to its industry.
Is Tamilnadu Petroproducts Efficiently Re-investing Its Profits?
Tamilnadu Petroproducts' low three-year median payout ratio of 19% (implying that it retains the remaining 81% of its profits) comes as a surprise when you pair it with the shrinking earnings. The low payout should mean that the company is retaining most of its earnings and consequently, should see some growth. So there might be other factors at play here which could potentially be hampering growth. For instance, the business has faced some headwinds.
Moreover, Tamilnadu Petroproducts has been paying dividends for seven years, which is a considerable amount of time, suggesting that management must have perceived that the shareholders prefer consistent dividends even though earnings have been shrinking.
Summary
Overall, we have mixed feelings about Tamilnadu Petroproducts. Even though it appears to be retaining most of its profits, given the low ROE, investors may not be benefitting from all that reinvestment after all. The low earnings growth suggests our theory correct. Wrapping up, we would proceed with caution with this company and one way of doing that would be to look at the risk profile of the business. To know the 2 risks we have identified for Tamilnadu Petroproducts visit our risks dashboard for free.
Valuation is complex, but we're here to simplify it.
Discover if Tamilnadu Petroproducts might be undervalued or overvalued with our detailed analysis, featuring fair value estimates, potential risks, dividends, insider trades, and its financial condition.
Access Free AnalysisHave feedback on this article? Concerned about the content? Get in touch with us directly. Alternatively, email editorial-team (at) simplywallst.com.
This article by Simply Wall St is general in nature. We provide commentary based on historical data and analyst forecasts only using an unbiased methodology and our articles are not intended to be financial advice. It does not constitute a recommendation to buy or sell any stock, and does not take account of your objectives, or your financial situation. We aim to bring you long-term focused analysis driven by fundamental data. Note that our analysis may not factor in the latest price-sensitive company announcements or qualitative material. Simply Wall St has no position in any stocks mentioned.
About NSEI:TNPETRO
Tamilnadu Petroproducts
Manufactures and sells petrochemical products in India.
Excellent balance sheet with proven track record.
Market Insights

Advertisement
Community Narratives
The "Molecular Pencil": Why Beam's Technology is Built to Win
Fair Value US$65.01|65.4% undervalued
DA
Community Contributor
The silent giant behind virtually every advanced chip powering AI, smartphones, and modern infrastructure.
Fair Value US$310.00|6.1% undervalued
OS
Community Contributor
ADP Stock: Solid Fundamentals, But AI Investments Test Its Margin Resilience
Fair Value US$387.77|34.2% undervalued
YI
Community Contributor
MINISO's fair value is projected at 26.69 with an anticipated PE ratio shift of 20x
Fair Value US$24.03|9.6% undervalued
BE
Community Contributor