Jindal Worldwide's (NSE:JINDWORLD) five-year earnings growth trails the 41% YoY shareholder returns


Buying shares in the best businesses can build meaningful wealth for you and your family. While the best companies are hard to find, but they can generate massive returns over long periods. Don't believe it? Then look at the Jindal Worldwide Limited (NSE:JINDWORLD) share price. It's 456% higher than it was five years ago. This just goes to show the value creation that some businesses can achieve. On top of that, the share price is up 14% in about a quarter. But this could be related to the strong market, which is up 15% in the last three months.
Since it's been a strong week for Jindal Worldwide shareholders, let's have a look at trend of the longer term fundamentals.
See our latest analysis for Jindal Worldwide
To paraphrase Benjamin Graham: Over the short term the market is a voting machine, but over the long term it's a weighing machine. By comparing earnings per share (EPS) and share price changes over time, we can get a feel for how investor attitudes to a company have morphed over time.
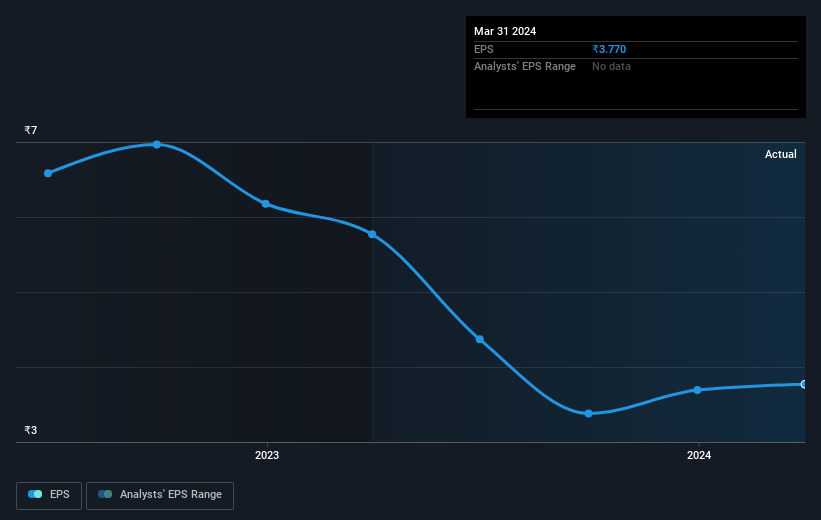
Over half a decade, Jindal Worldwide managed to grow its earnings per share at 20% a year. This EPS growth is lower than the 41% average annual increase in the share price. So it's fair to assume the market has a higher opinion of the business than it did five years ago. And that's hardly shocking given the track record of growth. This favorable sentiment is reflected in its (fairly optimistic) P/E ratio of 98.75.
You can see below how EPS has changed over time (discover the exact values by clicking on the image).
It's probably worth noting that the CEO is paid less than the median at similar sized companies. It's always worth keeping an eye on CEO pay, but a more important question is whether the company will grow earnings throughout the years. Dive deeper into the earnings by checking this interactive graph of Jindal Worldwide's earnings, revenue and cash flow.
What About Dividends?
When looking at investment returns, it is important to consider the difference between total shareholder return (TSR) and share price return. The TSR is a return calculation that accounts for the value of cash dividends (assuming that any dividend received was reinvested) and the calculated value of any discounted capital raisings and spin-offs. So for companies that pay a generous dividend, the TSR is often a lot higher than the share price return. In the case of Jindal Worldwide, it has a TSR of 459% for the last 5 years. That exceeds its share price return that we previously mentioned. This is largely a result of its dividend payments!
A Different Perspective
Jindal Worldwide shareholders are up 16% for the year (even including dividends). But that return falls short of the market. On the bright side, the longer term returns (running at about 41% a year, over half a decade) look better. It's quite possible the business continues to execute with prowess, even as the share price gains are slowing. It's always interesting to track share price performance over the longer term. But to understand Jindal Worldwide better, we need to consider many other factors. For instance, we've identified 1 warning sign for Jindal Worldwide that you should be aware of.
If you are like me, then you will not want to miss this free list of undervalued small caps that insiders are buying.
Please note, the market returns quoted in this article reflect the market weighted average returns of stocks that currently trade on Indian exchanges.
New: Manage All Your Stock Portfolios in One Place
We've created the ultimate portfolio companion for stock investors, and it's free.
• Connect an unlimited number of Portfolios and see your total in one currency
• Be alerted to new Warning Signs or Risks via email or mobile
• Track the Fair Value of your stocks
Have feedback on this article? Concerned about the content? Get in touch with us directly. Alternatively, email editorial-team (at) simplywallst.com.
This article by Simply Wall St is general in nature. We provide commentary based on historical data and analyst forecasts only using an unbiased methodology and our articles are not intended to be financial advice. It does not constitute a recommendation to buy or sell any stock, and does not take account of your objectives, or your financial situation. We aim to bring you long-term focused analysis driven by fundamental data. Note that our analysis may not factor in the latest price-sensitive company announcements or qualitative material. Simply Wall St has no position in any stocks mentioned.
Have feedback on this article? Concerned about the content? Get in touch with us directly. Alternatively, email editorial-team@simplywallst.com
About NSEI:JINDWORLD
Jindal Worldwide
Engages in the manufacture and sale of textile products in India and internationally.
Adequate balance sheet with questionable track record.

