- India
- /
- Consumer Durables
- /
- NSEI:BPL
Declining Stock and Decent Financials: Is The Market Wrong About BPL Limited (NSE:BPL)?


With its stock down 18% over the past three months, it is easy to disregard BPL (NSE:BPL). But if you pay close attention, you might find that its key financial indicators look quite decent, which could mean that the stock could potentially rise in the long-term given how markets usually reward more resilient long-term fundamentals. Particularly, we will be paying attention to BPL's ROE today.
Return on Equity or ROE is a test of how effectively a company is growing its value and managing investors’ money. Put another way, it reveals the company's success at turning shareholder investments into profits.
View our latest analysis for BPL
How Is ROE Calculated?
The formula for return on equity is:
Return on Equity = Net Profit (from continuing operations) ÷ Shareholders' Equity
So, based on the above formula, the ROE for BPL is:
6.3% = ₹242m ÷ ₹3.8b (Based on the trailing twelve months to June 2024).
The 'return' is the income the business earned over the last year. Another way to think of that is that for every ₹1 worth of equity, the company was able to earn ₹0.06 in profit.
Why Is ROE Important For Earnings Growth?
Thus far, we have learned that ROE measures how efficiently a company is generating its profits. We now need to evaluate how much profit the company reinvests or "retains" for future growth which then gives us an idea about the growth potential of the company. Assuming everything else remains unchanged, the higher the ROE and profit retention, the higher the growth rate of a company compared to companies that don't necessarily bear these characteristics.
BPL's Earnings Growth And 6.3% ROE
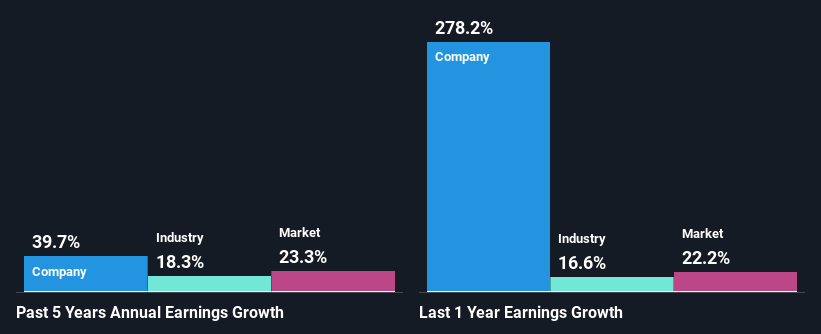
As you can see, BPL's ROE looks pretty weak. Even compared to the average industry ROE of 9.2%, the company's ROE is quite dismal. However, we we're pleasantly surprised to see that BPL grew its net income at a significant rate of 40% in the last five years. Therefore, there could be other reasons behind this growth. For example, it is possible that the company's management has made some good strategic decisions, or that the company has a low payout ratio.
As a next step, we compared BPL's net income growth with the industry, and pleasingly, we found that the growth seen by the company is higher than the average industry growth of 18%.
Earnings growth is a huge factor in stock valuation. The investor should try to establish if the expected growth or decline in earnings, whichever the case may be, is priced in. This then helps them determine if the stock is placed for a bright or bleak future. One good indicator of expected earnings growth is the P/E ratio which determines the price the market is willing to pay for a stock based on its earnings prospects. So, you may want to check if BPL is trading on a high P/E or a low P/E, relative to its industry.
Is BPL Using Its Retained Earnings Effectively?
BPL doesn't pay any regular dividends to its shareholders, meaning that the company has been reinvesting all of its profits into the business. This is likely what's driving the high earnings growth number discussed above.
Conclusion
On the whole, we do feel that BPL has some positive attributes. With a high rate of reinvestment, albeit at a low ROE, the company has managed to see a considerable growth in its earnings. While we won't completely dismiss the company, what we would do, is try to ascertain how risky the business is to make a more informed decision around the company. You can see the 2 risks we have identified for BPL by visiting our risks dashboard for free on our platform here.
Valuation is complex, but we're here to simplify it.
Discover if BPL might be undervalued or overvalued with our detailed analysis, featuring fair value estimates, potential risks, dividends, insider trades, and its financial condition.
Access Free AnalysisHave feedback on this article? Concerned about the content? Get in touch with us directly. Alternatively, email editorial-team (at) simplywallst.com.
This article by Simply Wall St is general in nature. We provide commentary based on historical data and analyst forecasts only using an unbiased methodology and our articles are not intended to be financial advice. It does not constitute a recommendation to buy or sell any stock, and does not take account of your objectives, or your financial situation. We aim to bring you long-term focused analysis driven by fundamental data. Note that our analysis may not factor in the latest price-sensitive company announcements or qualitative material. Simply Wall St has no position in any stocks mentioned.
About NSEI:BPL
BPL
Manufactures and sells consumer electronic products primarily in India.
Slightly overvalued with questionable track record.
Similar Companies
Market Insights

Community Narratives
