
Advertisement
Is Weakness In Axita Cotton Limited (NSE:AXITA) Stock A Sign That The Market Could be Wrong Given Its Strong Financial Prospects?
It is hard to get excited after looking at Axita Cotton's (NSE:AXITA) recent performance, when its stock has declined 18% over the past three months. However, stock prices are usually driven by a company’s financial performance over the long term, which in this case looks quite promising. Particularly, we will be paying attention to Axita Cotton's ROE today.
ROE or return on equity is a useful tool to assess how effectively a company can generate returns on the investment it received from its shareholders. Simply put, it is used to assess the profitability of a company in relation to its equity capital.
Check out our latest analysis for Axita Cotton
How Is ROE Calculated?
ROE can be calculated by using the formula:
Return on Equity = Net Profit (from continuing operations) ÷ Shareholders' Equity
So, based on the above formula, the ROE for Axita Cotton is:
36% = ₹210m ÷ ₹582m (Based on the trailing twelve months to December 2023).
The 'return' is the amount earned after tax over the last twelve months. That means that for every ₹1 worth of shareholders' equity, the company generated ₹0.36 in profit.
Why Is ROE Important For Earnings Growth?
Thus far, we have learned that ROE measures how efficiently a company is generating its profits. We now need to evaluate how much profit the company reinvests or "retains" for future growth which then gives us an idea about the growth potential of the company. Assuming everything else remains unchanged, the higher the ROE and profit retention, the higher the growth rate of a company compared to companies that don't necessarily bear these characteristics.
Axita Cotton's Earnings Growth And 36% ROE
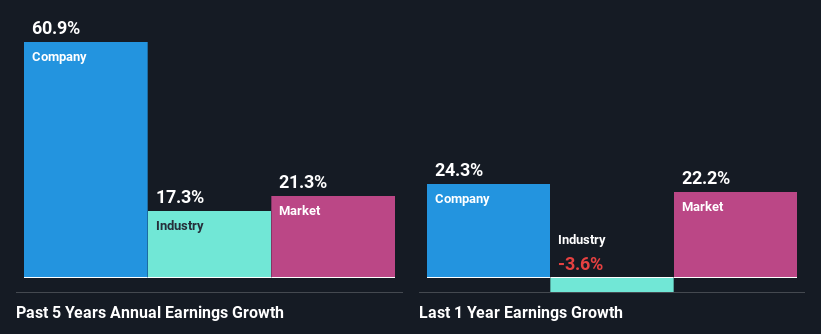
To begin with, Axita Cotton has a pretty high ROE which is interesting. Secondly, even when compared to the industry average of 7.4% the company's ROE is quite impressive. So, the substantial 61% net income growth seen by Axita Cotton over the past five years isn't overly surprising.
We then compared Axita Cotton's net income growth with the industry and we're pleased to see that the company's growth figure is higher when compared with the industry which has a growth rate of 17% in the same 5-year period.
The basis for attaching value to a company is, to a great extent, tied to its earnings growth. What investors need to determine next is if the expected earnings growth, or the lack of it, is already built into the share price. By doing so, they will have an idea if the stock is headed into clear blue waters or if swampy waters await. Is Axita Cotton fairly valued compared to other companies? These 3 valuation measures might help you decide.
Is Axita Cotton Efficiently Re-investing Its Profits?
Axita Cotton has a really low three-year median payout ratio of 6.4%, meaning that it has the remaining 94% left over to reinvest into its business. So it seems like the management is reinvesting profits heavily to grow its business and this reflects in its earnings growth number.
Along with seeing a growth in earnings, Axita Cotton only recently started paying dividends. Its quite possible that the company was looking to impress its shareholders.
Conclusion
Overall, we are quite pleased with Axita Cotton's performance. Specifically, we like that the company is reinvesting a huge chunk of its profits at a high rate of return. This of course has caused the company to see substantial growth in its earnings. If the company continues to grow its earnings the way it has, that could have a positive impact on its share price given how earnings per share influence long-term share prices. Remember, the price of a stock is also dependent on the perceived risk. Therefore investors must keep themselves informed about the risks involved before investing in any company. Our risks dashboard would have the 2 risks we have identified for Axita Cotton.
New: Manage All Your Stock Portfolios in One Place
We've created the ultimate portfolio companion for stock investors, and it's free.
• Connect an unlimited number of Portfolios and see your total in one currency
• Be alerted to new Warning Signs or Risks via email or mobile
• Track the Fair Value of your stocks
Have feedback on this article? Concerned about the content? Get in touch with us directly. Alternatively, email editorial-team (at) simplywallst.com.
This article by Simply Wall St is general in nature. We provide commentary based on historical data and analyst forecasts only using an unbiased methodology and our articles are not intended to be financial advice. It does not constitute a recommendation to buy or sell any stock, and does not take account of your objectives, or your financial situation. We aim to bring you long-term focused analysis driven by fundamental data. Note that our analysis may not factor in the latest price-sensitive company announcements or qualitative material. Simply Wall St has no position in any stocks mentioned.
About NSEI:AXITA
Axita Cotton
Engages in manufacturing, processing, finishing, and trading of cotton bales, yarns, seeds, and agri commodities in India.
Excellent balance sheet and good value.
Similar Companies
Market Insights

Advertisement
Community Narratives
MINISO's fair value is projected at 26.69 with an anticipated PE ratio shift of 20x
Fair Value US$24.03|9.6% undervalued
BE
Community Contributor
Procter & Gamble: A Dividend Giant Facing Slowing Growth
Fair Value US$119.81|24.0% overvalued
AN
Community Contributor
Eli Lilly's Future Growth Driven by Tirzepatide and Favorable Market Conditions
Fair Value US$1.19k|16.9% undervalued
EA
Community Contributor