

Does the June share price for Ircon International Limited (NSE:IRCON) reflect what it's really worth? Today, we will estimate the stock's intrinsic value by taking the expected future cash flows and discounting them to today's value. This will be done using the Discounted Cash Flow (DCF) model. There's really not all that much to it, even though it might appear quite complex.
We generally believe that a company's value is the present value of all of the cash it will generate in the future. However, a DCF is just one valuation metric among many, and it is not without flaws. Anyone interested in learning a bit more about intrinsic value should have a read of the Simply Wall St analysis model.
See our latest analysis for Ircon International
Step by step through the calculation
We use what is known as a 2-stage model, which simply means we have two different periods of growth rates for the company's cash flows. Generally the first stage is higher growth, and the second stage is a lower growth phase. In the first stage we need to estimate the cash flows to the business over the next ten years. Seeing as no analyst estimates of free cash flow are available to us, we have extrapolate the previous free cash flow (FCF) from the company's last reported value. We assume companies with shrinking free cash flow will slow their rate of shrinkage, and that companies with growing free cash flow will see their growth rate slow, over this period. We do this to reflect that growth tends to slow more in the early years than it does in later years.
Generally we assume that a dollar today is more valuable than a dollar in the future, and so the sum of these future cash flows is then discounted to today's value:
10-year free cash flow (FCF) estimate
| 2021 | 2022 | 2023 | 2024 | 2025 | 2026 | 2027 | 2028 | 2029 | 2030 | |
| Levered FCF (₹, Millions) | ₹3.24b | ₹3.55b | ₹3.86b | ₹4.18b | ₹4.50b | ₹4.84b | ₹5.19b | ₹5.56b | ₹5.95b | ₹6.37b |
| Growth Rate Estimate Source | Est @ 10.64% | Est @ 9.5% | Est @ 8.7% | Est @ 8.14% | Est @ 7.75% | Est @ 7.48% | Est @ 7.29% | Est @ 7.15% | Est @ 7.06% | Est @ 6.99% |
| Present Value (₹, Millions) Discounted @ 15% | ₹2.8k | ₹2.7k | ₹2.6k | ₹2.4k | ₹2.3k | ₹2.1k | ₹2.0k | ₹1.8k | ₹1.7k | ₹1.6k |
("Est" = FCF growth rate estimated by Simply Wall St)
Present Value of 10-year Cash Flow (PVCF) = ₹22b
The second stage is also known as Terminal Value, this is the business's cash flow after the first stage. For a number of reasons a very conservative growth rate is used that cannot exceed that of a country's GDP growth. In this case we have used the 5-year average of the 10-year government bond yield (6.8%) to estimate future growth. In the same way as with the 10-year 'growth' period, we discount future cash flows to today's value, using a cost of equity of 15%.
Terminal Value (TV)= FCF2030 × (1 + g) ÷ (r – g) = ₹6.4b× (1 + 6.8%) ÷ (15%– 6.8%) = ₹86b
Present Value of Terminal Value (PVTV)= TV / (1 + r)10= ₹86b÷ ( 1 + 15%)10= ₹22b
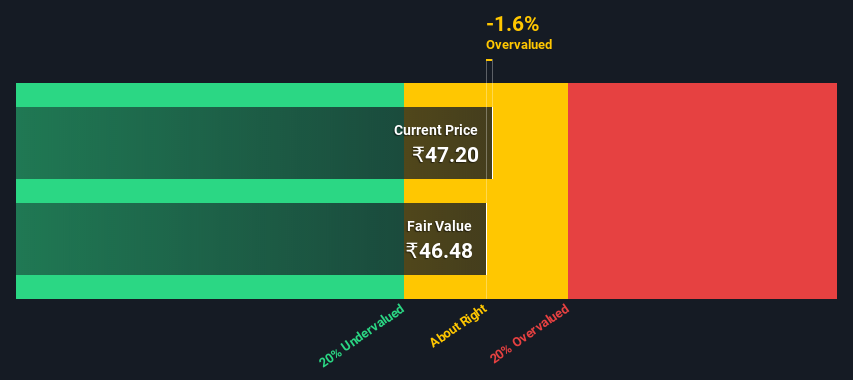
The total value is the sum of cash flows for the next ten years plus the discounted terminal value, which results in the Total Equity Value, which in this case is ₹44b. The last step is to then divide the equity value by the number of shares outstanding. Compared to the current share price of ₹47.2, the company appears around fair value at the time of writing. Remember though, that this is just an approximate valuation, and like any complex formula - garbage in, garbage out.
The assumptions
The calculation above is very dependent on two assumptions. The first is the discount rate and the other is the cash flows. You don't have to agree with these inputs, I recommend redoing the calculations yourself and playing with them. The DCF also does not consider the possible cyclicality of an industry, or a company's future capital requirements, so it does not give a full picture of a company's potential performance. Given that we are looking at Ircon International as potential shareholders, the cost of equity is used as the discount rate, rather than the cost of capital (or weighted average cost of capital, WACC) which accounts for debt. In this calculation we've used 15%, which is based on a levered beta of 1.156. Beta is a measure of a stock's volatility, compared to the market as a whole. We get our beta from the industry average beta of globally comparable companies, with an imposed limit between 0.8 and 2.0, which is a reasonable range for a stable business.
Looking Ahead:
Although the valuation of a company is important, it is only one of many factors that you need to assess for a company. It's not possible to obtain a foolproof valuation with a DCF model. Instead the best use for a DCF model is to test certain assumptions and theories to see if they would lead to the company being undervalued or overvalued. For instance, if the terminal value growth rate is adjusted slightly, it can dramatically alter the overall result. For Ircon International, there are three relevant aspects you should assess:
- Risks: We feel that you should assess the 2 warning signs for Ircon International (1 makes us a bit uncomfortable!) we've flagged before making an investment in the company.
- Other Solid Businesses: Low debt, high returns on equity and good past performance are fundamental to a strong business. Why not explore our interactive list of stocks with solid business fundamentals to see if there are other companies you may not have considered!
- Other Environmentally-Friendly Companies: Concerned about the environment and think consumers will buy eco-friendly products more and more? Browse through our interactive list of companies that are thinking about a greener future to discover some stocks you may not have thought of!
PS. The Simply Wall St app conducts a discounted cash flow valuation for every stock on the NSEI every day. If you want to find the calculation for other stocks just search here.
When trading Ircon International or any other investment, use the platform considered by many to be the Professional's Gateway to the Worlds Market, Interactive Brokers. You get the lowest-cost* trading on stocks, options, futures, forex, bonds and funds worldwide from a single integrated account. Promoted
New: AI Stock Screener & Alerts
Our new AI Stock Screener scans the market every day to uncover opportunities.
• Dividend Powerhouses (3%+ Yield)
• Undervalued Small Caps with Insider Buying
• High growth Tech and AI Companies
Or build your own from over 50 metrics.
This article by Simply Wall St is general in nature. It does not constitute a recommendation to buy or sell any stock, and does not take account of your objectives, or your financial situation. We aim to bring you long-term focused analysis driven by fundamental data. Note that our analysis may not factor in the latest price-sensitive company announcements or qualitative material. Simply Wall St has no position in any stocks mentioned.
*Interactive Brokers Rated Lowest Cost Broker by StockBrokers.com Annual Online Review 2020
Have feedback on this article? Concerned about the content? Get in touch with us directly. Alternatively, email editorial-team (at) simplywallst.com.
About NSEI:IRCON
Excellent balance sheet and fair value.

