BEML's (NSE:BEML) 48% CAGR outpaced the company's earnings growth over the same five-year period


For many, the main point of investing in the stock market is to achieve spectacular returns. And highest quality companies can see their share prices grow by huge amounts. Don't believe it? Then look at the BEML Limited (NSE:BEML) share price. It's 473% higher than it was five years ago. And this is just one example of the epic gains achieved by some long term investors. It's also good to see the share price up 70% over the last quarter.
The past week has proven to be lucrative for BEML investors, so let's see if fundamentals drove the company's five-year performance.
See our latest analysis for BEML
While the efficient markets hypothesis continues to be taught by some, it has been proven that markets are over-reactive dynamic systems, and investors are not always rational. By comparing earnings per share (EPS) and share price changes over time, we can get a feel for how investor attitudes to a company have morphed over time.
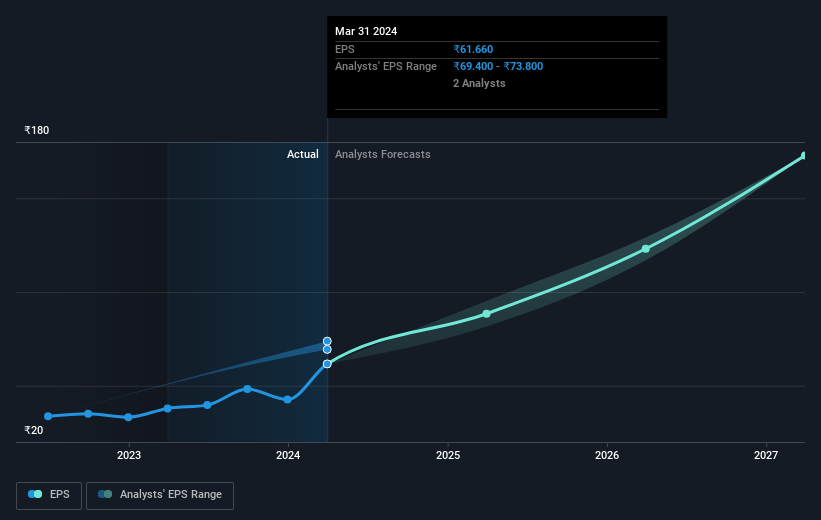
During five years of share price growth, BEML achieved compound earnings per share (EPS) growth of 35% per year. So the EPS growth rate is rather close to the annualized share price gain of 42% per year. That suggests that the market sentiment around the company hasn't changed much over that time. Indeed, it would appear the share price is reacting to the EPS.
You can see how EPS has changed over time in the image below (click on the chart to see the exact values).
It's probably worth noting that the CEO is paid less than the median at similar sized companies. It's always worth keeping an eye on CEO pay, but a more important question is whether the company will grow earnings throughout the years. This free interactive report on BEML's earnings, revenue and cash flow is a great place to start, if you want to investigate the stock further.
What About Dividends?
When looking at investment returns, it is important to consider the difference between total shareholder return (TSR) and share price return. The TSR incorporates the value of any spin-offs or discounted capital raisings, along with any dividends, based on the assumption that the dividends are reinvested. Arguably, the TSR gives a more comprehensive picture of the return generated by a stock. As it happens, BEML's TSR for the last 5 years was 603%, which exceeds the share price return mentioned earlier. This is largely a result of its dividend payments!
A Different Perspective
It's good to see that BEML has rewarded shareholders with a total shareholder return of 201% in the last twelve months. And that does include the dividend. That gain is better than the annual TSR over five years, which is 48%. Therefore it seems like sentiment around the company has been positive lately. Someone with an optimistic perspective could view the recent improvement in TSR as indicating that the business itself is getting better with time. I find it very interesting to look at share price over the long term as a proxy for business performance. But to truly gain insight, we need to consider other information, too. To that end, you should learn about the 2 warning signs we've spotted with BEML (including 1 which makes us a bit uncomfortable) .
Of course BEML may not be the best stock to buy. So you may wish to see this free collection of growth stocks.
Please note, the market returns quoted in this article reflect the market weighted average returns of stocks that currently trade on Indian exchanges.
Valuation is complex, but we're here to simplify it.
Discover if BEML might be undervalued or overvalued with our detailed analysis, featuring fair value estimates, potential risks, dividends, insider trades, and its financial condition.
Access Free AnalysisHave feedback on this article? Concerned about the content? Get in touch with us directly. Alternatively, email editorial-team (at) simplywallst.com.
This article by Simply Wall St is general in nature. We provide commentary based on historical data and analyst forecasts only using an unbiased methodology and our articles are not intended to be financial advice. It does not constitute a recommendation to buy or sell any stock, and does not take account of your objectives, or your financial situation. We aim to bring you long-term focused analysis driven by fundamental data. Note that our analysis may not factor in the latest price-sensitive company announcements or qualitative material. Simply Wall St has no position in any stocks mentioned.
Have feedback on this article? Concerned about the content? Get in touch with us directly. Alternatively, email editorial-team@simplywallst.com
About NSEI:BEML
BEML
Provides products and services to the mining and construction, rail and metro, power, and defense and aerospace sectors in India.
Flawless balance sheet with solid track record and pays a dividend.

