- India
- /
- Industrials
- /
- NSEI:APARINDS
Apar Industries (NSE:APARINDS) Is Reinvesting At Lower Rates Of Return


If you're looking for a multi-bagger, there's a few things to keep an eye out for. One common approach is to try and find a company with returns on capital employed (ROCE) that are increasing, in conjunction with a growing amount of capital employed. Ultimately, this demonstrates that it's a business that is reinvesting profits at increasing rates of return. Having said that, while the ROCE is currently high for Apar Industries (NSE:APARINDS), we aren't jumping out of our chairs because returns are decreasing.
Understanding Return On Capital Employed (ROCE)
For those who don't know, ROCE is a measure of a company's yearly pre-tax profit (its return), relative to the capital employed in the business. To calculate this metric for Apar Industries, this is the formula:
Return on Capital Employed = Earnings Before Interest and Tax (EBIT) ÷ (Total Assets - Current Liabilities)
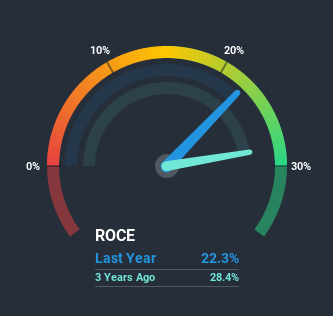
0.22 = ₹3.4b ÷ (₹39b - ₹24b) (Based on the trailing twelve months to December 2020).
Thus, Apar Industries has an ROCE of 22%. In absolute terms that's a great return and it's even better than the Industrials industry average of 9.4%.
See our latest analysis for Apar Industries
In the above chart we have measured Apar Industries' prior ROCE against its prior performance, but the future is arguably more important. If you'd like, you can check out the forecasts from the analysts covering Apar Industries here for free.
What The Trend Of ROCE Can Tell Us
On the surface, the trend of ROCE at Apar Industries doesn't inspire confidence. To be more specific, while the ROCE is still high, it's fallen from 37% where it was five years ago. Given the business is employing more capital while revenue has slipped, this is a bit concerning. If this were to continue, you might be looking at a company that is trying to reinvest for growth but is actually losing market share since sales haven't increased.
On a separate but related note, it's important to know that Apar Industries has a current liabilities to total assets ratio of 61%, which we'd consider pretty high. This effectively means that suppliers (or short-term creditors) are funding a large portion of the business, so just be aware that this can introduce some elements of risk. While it's not necessarily a bad thing, it can be beneficial if this ratio is lower.
The Bottom Line On Apar Industries' ROCE
In summary, we're somewhat concerned by Apar Industries' diminishing returns on increasing amounts of capital. In spite of that, the stock has delivered a 0.5% return to shareholders who held over the last five years. Either way, we aren't huge fans of the current trends and so with that we think you might find better investments elsewhere.
If you want to continue researching Apar Industries, you might be interested to know about the 1 warning sign that our analysis has discovered.
If you want to search for more stocks that have been earning high returns, check out this free list of stocks with solid balance sheets that are also earning high returns on equity.
When trading Apar Industries or any other investment, use the platform considered by many to be the Professional's Gateway to the Worlds Market, Interactive Brokers. You get the lowest-cost* trading on stocks, options, futures, forex, bonds and funds worldwide from a single integrated account. Promoted
New: Manage All Your Stock Portfolios in One Place
We've created the ultimate portfolio companion for stock investors, and it's free.
• Connect an unlimited number of Portfolios and see your total in one currency
• Be alerted to new Warning Signs or Risks via email or mobile
• Track the Fair Value of your stocks
This article by Simply Wall St is general in nature. It does not constitute a recommendation to buy or sell any stock, and does not take account of your objectives, or your financial situation. We aim to bring you long-term focused analysis driven by fundamental data. Note that our analysis may not factor in the latest price-sensitive company announcements or qualitative material. Simply Wall St has no position in any stocks mentioned.
*Interactive Brokers Rated Lowest Cost Broker by StockBrokers.com Annual Online Review 2020
Have feedback on this article? Concerned about the content? Get in touch with us directly. Alternatively, email editorial-team (at) simplywallst.com.
About NSEI:APARINDS
APAR Industries
Engages in the electrical and metallurgical engineering business in India and internationally.
Excellent balance sheet with proven track record.

