
Advertisement
- Hong Kong
- /
- Electronic Equipment and Components
- /
- SEHK:1415
Don't Sell Cowell e Holdings Inc. (HKG:1415) Before You Read This
Want to participate in a short research study? Help shape the future of investing tools and you could win a $250 gift card!
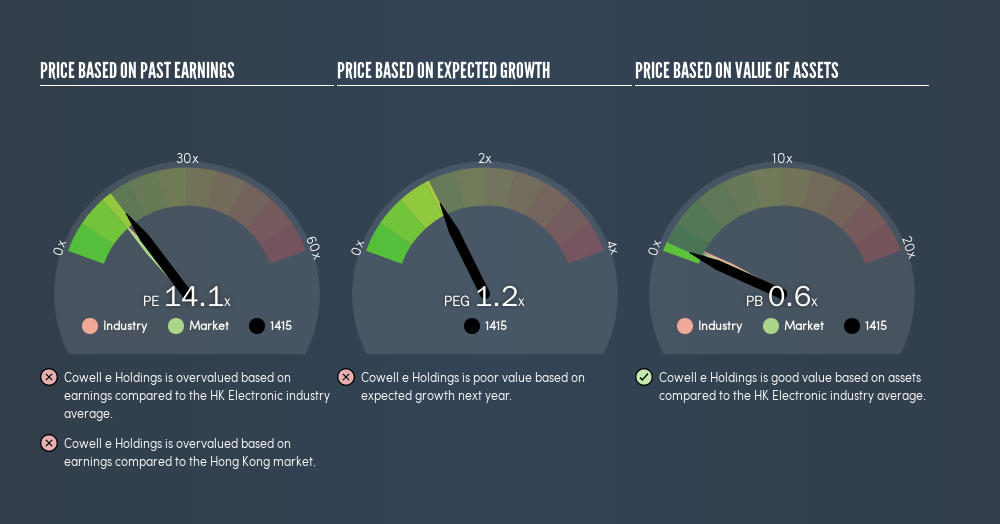
Today, we'll introduce the concept of the P/E ratio for those who are learning about investing. We'll show how you can use Cowell e Holdings Inc.'s (HKG:1415) P/E ratio to inform your assessment of the investment opportunity. Based on the last twelve months, Cowell e Holdings's P/E ratio is 14.1. That means that at current prices, buyers pay HK$14.1 for every HK$1 in trailing yearly profits.
View our latest analysis for Cowell e Holdings
How Do I Calculate A Price To Earnings Ratio?
The formula for P/E is:
Price to Earnings Ratio = Share Price (in reporting currency) ÷ Earnings per Share (EPS)
Or for Cowell e Holdings:
P/E of 14.1 = $0.24 (Note: this is the share price in the reporting currency, namely, USD ) ÷ $0.017 (Based on the trailing twelve months to December 2018.)
Is A High Price-to-Earnings Ratio Good?
A higher P/E ratio means that investors are paying a higher price for each HK$1 of company earnings. That isn't a good or a bad thing on its own, but a high P/E means that buyers have a higher opinion of the business's prospects, relative to stocks with a lower P/E.
How Growth Rates Impact P/E Ratios
When earnings fall, the 'E' decreases, over time. That means even if the current P/E is low, it will increase over time if the share price stays flat. So while a stock may look cheap based on past earnings, it could be expensive based on future earnings.
Cowell e Holdings saw earnings per share decrease by 50% last year. And EPS is down 24% a year, over the last 5 years. This growth rate might warrant a below average P/E ratio.
How Does Cowell e Holdings's P/E Ratio Compare To Its Peers?
One good way to get a quick read on what market participants expect of a company is to look at its P/E ratio. As you can see below, Cowell e Holdings has a higher P/E than the average company (12.3) in the electronic industry.
Cowell e Holdings's P/E tells us that market participants think the company will perform better than its industry peers, going forward. Shareholders are clearly optimistic, but the future is always uncertain. So investors should delve deeper. I like to check if company insiders have been buying or selling.
Don't Forget: The P/E Does Not Account For Debt or Bank Deposits
Don't forget that the P/E ratio considers market capitalization. In other words, it does not consider any debt or cash that the company may have on the balance sheet. Hypothetically, a company could reduce its future P/E ratio by spending its cash (or taking on debt) to achieve higher earnings.
Spending on growth might be good or bad a few years later, but the point is that the P/E ratio does not account for the option (or lack thereof).
So What Does Cowell e Holdings's Balance Sheet Tell Us?
With net cash of US$133m, Cowell e Holdings has a very strong balance sheet, which may be important for its business. Having said that, at 67% of its market capitalization the cash hoard would contribute towards a higher P/E ratio.
The Bottom Line On Cowell e Holdings's P/E Ratio
Cowell e Holdings has a P/E of 14.1. That's higher than the average in the HK market, which is 12. Falling earnings per share is probably keeping traditional value investors away, but the healthy balance sheet means the company retains potential for future growth. If fails to eventuate, the current high P/E could prove to be temporary, as the share price falls.
When the market is wrong about a stock, it gives savvy investors an opportunity. As value investor Benjamin Graham famously said, 'In the short run, the market is a voting machine but in the long run, it is a weighing machine.' So this freereport on the analyst consensus forecasts could help you make a master move on this stock.
But note: Cowell e Holdings may not be the best stock to buy. So take a peek at this freelist of interesting companies with strong recent earnings growth (and a P/E ratio below 20).
We aim to bring you long-term focused research analysis driven by fundamental data. Note that our analysis may not factor in the latest price-sensitive company announcements or qualitative material.
If you spot an error that warrants correction, please contact the editor at editorial-team@simplywallst.com. This article by Simply Wall St is general in nature. It does not constitute a recommendation to buy or sell any stock, and does not take account of your objectives, or your financial situation. Simply Wall St has no position in the stocks mentioned. Thank you for reading.
About SEHK:1415
Cowell e Holdings
An investment holding company, engages in the design, development, manufacture and sale of modules and system integration products for smartphones, multimedia tablets and other mobile devices.
Outstanding track record with high growth potential.
Market Insights

Advertisement
Weekly Picks
RO


RockeTeller on Santacruz Silver Mining ·
Crazy Undervalued 42 Baggers Silver Play (Active & Running Mine)
Fair Value:CA$8696.7% undervalued
71 followersusers have followed this narrative
7 commentsusers have commented on this narrative
20 likesusers have liked this narrative
RO


Robbo on Fiducian Group ·
Fiducian: Compliance Clouds or Value Opportunity?
Fair Value:AU$123.9% undervalued
11 followersusers have followed this narrative
0 commentsusers have commented on this narrative
0 likesusers have liked this narrative
WO

woodworthfund on Willamette Valley Vineyards ·
Willamette Valley Vineyards (WVVI): Not-So-Great Value
Fair Value:US$245.0% overvalued
11 followersusers have followed this narrative
0 commentsusers have commented on this narrative
1 likeusers have liked this narrative
Recently Updated Narratives
RE

RedhawkCC on Prime Medicine ·
PRME remains a long shot but publication in the New England Journal of Medicine helps.
Fair Value:US$0.0469.1k% overvalued
1 followerusers have followed this narrative
0 commentsusers have commented on this narrative
0 likesusers have liked this narrative
RA

RacerBVN on iShares Trust - iShares Preferred and Income Securities ETF ·
This one is all about the tax benefits
Fair Value:US$54.5543.4% undervalued
1 followerusers have followed this narrative
0 commentsusers have commented on this narrative
0 likesusers have liked this narrative
FA

FatPie on SoFi Technologies ·
Estimated Share Price is $79.54 using the Buffett Value Calculation
Fair Value:US$79.5465.3% undervalued
1 followerusers have followed this narrative
0 commentsusers have commented on this narrative
0 likesusers have liked this narrative
Popular Narratives
TH


TheWallstreetKing on MicroVision ·
MicroVision will explode future revenue by 380.37% with a vision towards success
Fair Value:US$6098.5% undervalued
118 followersusers have followed this narrative
11 commentsusers have commented on this narrative
22 likesusers have liked this narrative
AN


AnalystConsensusTarget on NVIDIA ·
NVDA: Expanding AI Demand Will Drive Major Data Center Investments Through 2026
Fair Value:US$250.3925.9% undervalued
961 followersusers have followed this narrative
6 commentsusers have commented on this narrative
25 likesusers have liked this narrative
RO
RockeTeller on Santacruz Silver Mining ·
Crazy Undervalued 42 Baggers Silver Play (Active & Running Mine)
Fair Value:CA$8696.7% undervalued
71 followersusers have followed this narrative
7 commentsusers have commented on this narrative
20 likesusers have liked this narrative
