
Advertisement
- Hong Kong
- /
- Personal Products
- /
- SEHK:1259
Prosperous Future Holdings Limited (HKG:1259) Surges 58% Yet Its Low P/S Is No Reason For Excitement
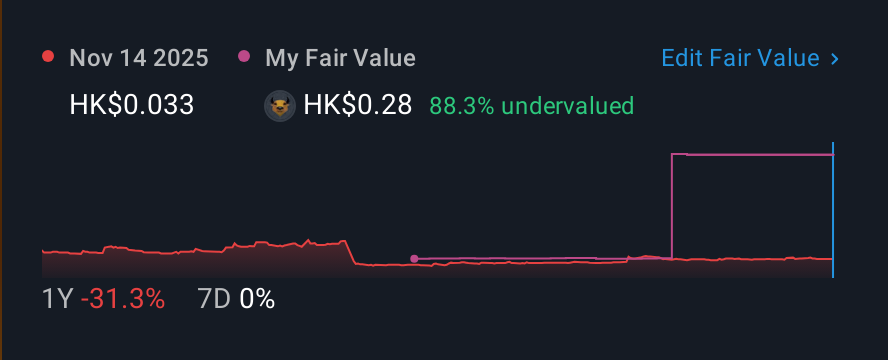
Prosperous Future Holdings Limited (HKG:1259) shares have continued their recent momentum with a 58% gain in the last month alone. Not all shareholders will be feeling jubilant, since the share price is still down a very disappointing 44% in the last twelve months.
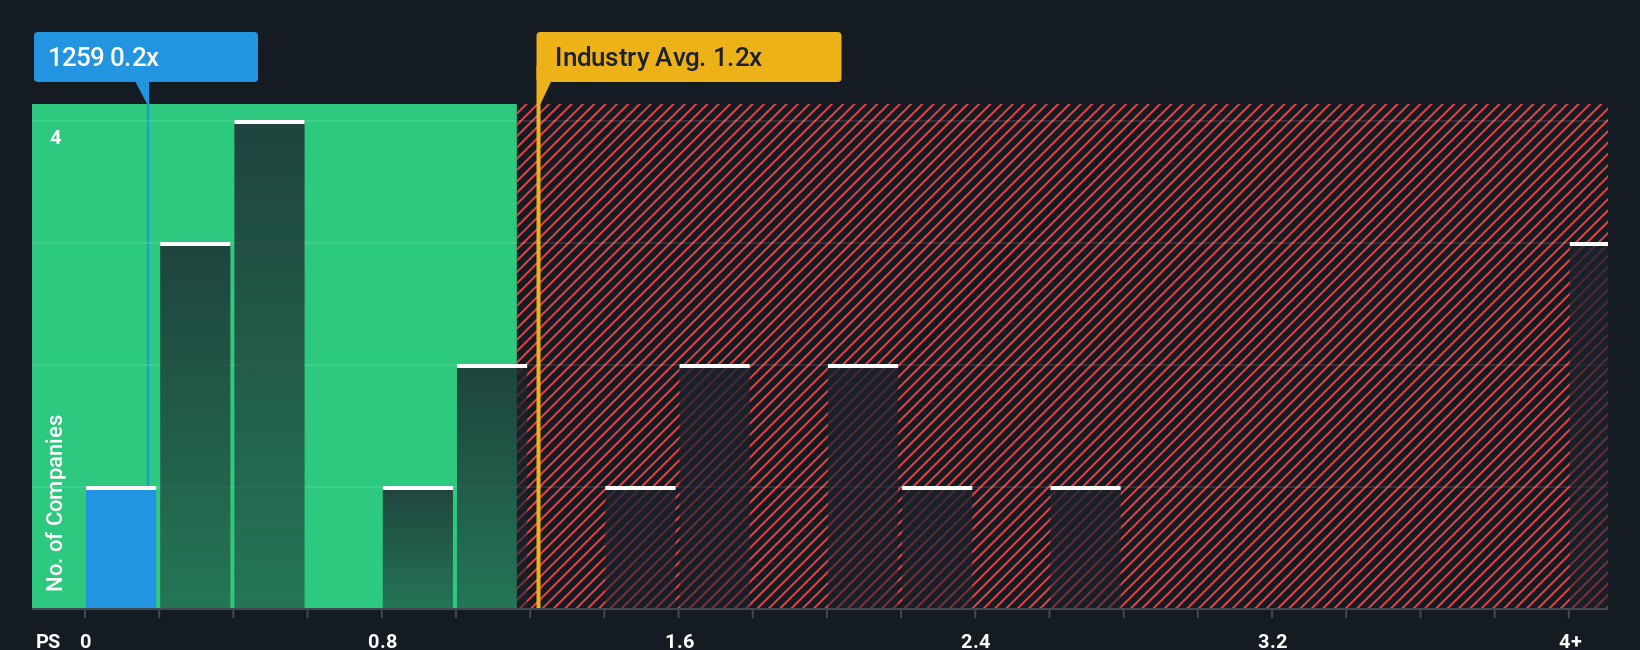
Although its price has surged higher, given about half the companies operating in Hong Kong's Personal Products industry have price-to-sales ratios (or "P/S") above 1.2x, you may still consider Prosperous Future Holdings as an attractive investment with its 0.2x P/S ratio. Although, it's not wise to just take the P/S at face value as there may be an explanation why it's limited.
View our latest analysis for Prosperous Future Holdings
What Does Prosperous Future Holdings' P/S Mean For Shareholders?
As an illustration, revenue has deteriorated at Prosperous Future Holdings over the last year, which is not ideal at all. One possibility is that the P/S is low because investors think the company won't do enough to avoid underperforming the broader industry in the near future. Those who are bullish on Prosperous Future Holdings will be hoping that this isn't the case so that they can pick up the stock at a lower valuation.
We don't have analyst forecasts, but you can see how recent trends are setting up the company for the future by checking out our free report on Prosperous Future Holdings' earnings, revenue and cash flow.What Are Revenue Growth Metrics Telling Us About The Low P/S?
In order to justify its P/S ratio, Prosperous Future Holdings would need to produce sluggish growth that's trailing the industry.
Retrospectively, the last year delivered a frustrating 1.7% decrease to the company's top line. This means it has also seen a slide in revenue over the longer-term as revenue is down 16% in total over the last three years. Accordingly, shareholders would have felt downbeat about the medium-term rates of revenue growth.
In contrast to the company, the rest of the industry is expected to grow by 24% over the next year, which really puts the company's recent medium-term revenue decline into perspective.
In light of this, it's understandable that Prosperous Future Holdings' P/S would sit below the majority of other companies. However, we think shrinking revenues are unlikely to lead to a stable P/S over the longer term, which could set up shareholders for future disappointment. There's potential for the P/S to fall to even lower levels if the company doesn't improve its top-line growth.
What We Can Learn From Prosperous Future Holdings' P/S?
The latest share price surge wasn't enough to lift Prosperous Future Holdings' P/S close to the industry median. We'd say the price-to-sales ratio's power isn't primarily as a valuation instrument but rather to gauge current investor sentiment and future expectations.
As we suspected, our examination of Prosperous Future Holdings revealed its shrinking revenue over the medium-term is contributing to its low P/S, given the industry is set to grow. Right now shareholders are accepting the low P/S as they concede future revenue probably won't provide any pleasant surprises either. If recent medium-term revenue trends continue, it's hard to see the share price moving strongly in either direction in the near future under these circumstances.
And what about other risks? Every company has them, and we've spotted 3 warning signs for Prosperous Future Holdings (of which 2 are potentially serious!) you should know about.
If strong companies turning a profit tickle your fancy, then you'll want to check out this free list of interesting companies that trade on a low P/E (but have proven they can grow earnings).
New: Manage All Your Stock Portfolios in One Place
We've created the ultimate portfolio companion for stock investors, and it's free.
• Connect an unlimited number of Portfolios and see your total in one currency
• Be alerted to new Warning Signs or Risks via email or mobile
• Track the Fair Value of your stocks
Have feedback on this article? Concerned about the content? Get in touch with us directly. Alternatively, email editorial-team (at) simplywallst.com.
This article by Simply Wall St is general in nature. We provide commentary based on historical data and analyst forecasts only using an unbiased methodology and our articles are not intended to be financial advice. It does not constitute a recommendation to buy or sell any stock, and does not take account of your objectives, or your financial situation. We aim to bring you long-term focused analysis driven by fundamental data. Note that our analysis may not factor in the latest price-sensitive company announcements or qualitative material. Simply Wall St has no position in any stocks mentioned.
About SEHK:1259
Prosperous Future Holdings
An investment holding company, engages in selling of frozen food and beverage products in Hong Kong and internationally.
Flawless balance sheet and slightly overvalued.
Market Insights

Advertisement
Community Narratives
MINISO's fair value is projected at 26.69 with an anticipated PE ratio shift of 20x
Fair Value US$24.03|11.4% undervalued
BE
Community Contributor
Procter & Gamble: A Dividend Giant Facing Slowing Growth
Fair Value US$119.81|23.5% overvalued
AN
Community Contributor
Eli Lilly's Future Growth Driven by Tirzepatide and Favorable Market Conditions
Fair Value US$1.19k|14.0% undervalued
EA
Community Contributor