
Advertisement
- Hong Kong
- /
- Capital Markets
- /
- SEHK:1709
33% earnings growth over 1 year has not materialized into gains for DL Holdings Group (HKG:1709) shareholders over that period
Investors can approximate the average market return by buying an index fund. But if you buy individual stocks, you can do both better or worse than that. That downside risk was realized by DL Holdings Group Limited (HKG:1709) shareholders over the last year, as the share price declined 42%. That's disappointing when you consider the market returned 43%. Longer term shareholders haven't suffered as badly, since the stock is down a comparatively less painful 5.5% in three years. Even worse, it's down 23% in about a month, which isn't fun at all.
After losing 3.1% this past week, it's worth investigating the company's fundamentals to see what we can infer from past performance.
To paraphrase Benjamin Graham: Over the short term the market is a voting machine, but over the long term it's a weighing machine. One imperfect but simple way to consider how the market perception of a company has shifted is to compare the change in the earnings per share (EPS) with the share price movement.
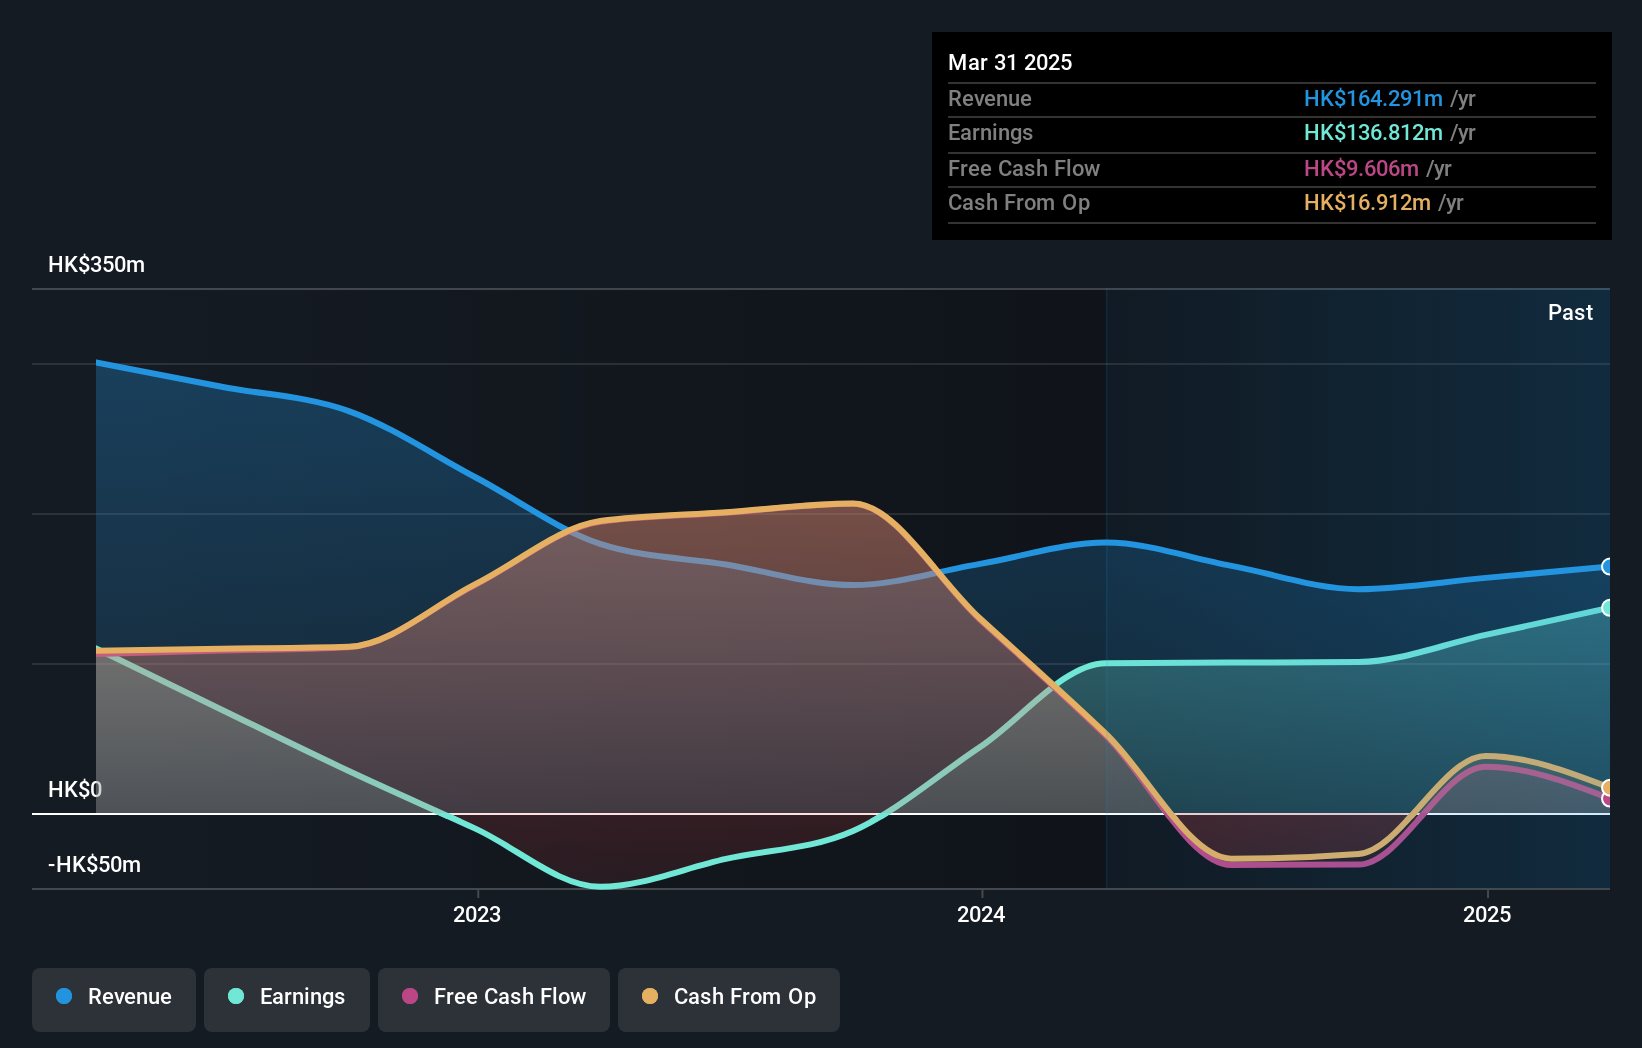
During the unfortunate twelve months during which the DL Holdings Group share price fell, it actually saw its earnings per share (EPS) improve by 33%. It's quite possible that growth expectations may have been unreasonable in the past.
It's surprising to see the share price fall so much, despite the improved EPS. So it's easy to justify a look at some other metrics.
In contrast, the 8.9% drop in revenue is a real concern. If the market sees the weak revenue as jeopardising EPS, that could explain the lower share price.
The image below shows how earnings and revenue have tracked over time (if you click on the image you can see greater detail).
We like that insiders have been buying shares in the last twelve months. Having said that, most people consider earnings and revenue growth trends to be a more meaningful guide to the business. Dive deeper into the earnings by checking this interactive graph of DL Holdings Group's earnings, revenue and cash flow.
A Different Perspective
DL Holdings Group shareholders are down 42% for the year, but the market itself is up 43%. However, keep in mind that even the best stocks will sometimes underperform the market over a twelve month period. On the bright side, long term shareholders have made money, with a gain of 3% per year over half a decade. It could be that the recent sell-off is an opportunity, so it may be worth checking the fundamental data for signs of a long term growth trend. It's always interesting to track share price performance over the longer term. But to understand DL Holdings Group better, we need to consider many other factors. Even so, be aware that DL Holdings Group is showing 3 warning signs in our investment analysis , and 1 of those is a bit unpleasant...
DL Holdings Group is not the only stock that insiders are buying. For those who like to find lesser know companies this free list of growing companies with recent insider purchasing, could be just the ticket.
Please note, the market returns quoted in this article reflect the market weighted average returns of stocks that currently trade on Hong Kong exchanges.
New: Manage All Your Stock Portfolios in One Place
We've created the ultimate portfolio companion for stock investors, and it's free.
• Connect an unlimited number of Portfolios and see your total in one currency
• Be alerted to new Warning Signs or Risks via email or mobile
• Track the Fair Value of your stocks
Have feedback on this article? Concerned about the content? Get in touch with us directly. Alternatively, email editorial-team (at) simplywallst.com.
This article by Simply Wall St is general in nature. We provide commentary based on historical data and analyst forecasts only using an unbiased methodology and our articles are not intended to be financial advice. It does not constitute a recommendation to buy or sell any stock, and does not take account of your objectives, or your financial situation. We aim to bring you long-term focused analysis driven by fundamental data. Note that our analysis may not factor in the latest price-sensitive company announcements or qualitative material. Simply Wall St has no position in any stocks mentioned.
About SEHK:1709
DL Holdings Group
An investment holding company, engages in the financial services of licensed business.
Proven track record with mediocre balance sheet.
Similar Companies
Market Insights

Advertisement
Community Narratives
The "Molecular Pencil": Why Beam's Technology is Built to Win
Fair Value US$65.01|65.4% undervalued
DA
Community Contributor
The silent giant behind virtually every advanced chip powering AI, smartphones, and modern infrastructure.
Fair Value US$310.00|6.1% undervalued
OS
Community Contributor
ADP Stock: Solid Fundamentals, But AI Investments Test Its Margin Resilience
Fair Value US$387.77|34.2% undervalued
YI
Community Contributor
MINISO's fair value is projected at 26.69 with an anticipated PE ratio shift of 20x
Fair Value US$24.03|9.6% undervalued
BE
Community Contributor