Stock Analysis
- Hong Kong
- /
- Consumer Durables
- /
- SEHK:1568
Sundart Holdings (HKG:1568) stock falls 15% in past week as five-year earnings and shareholder returns continue downward trend

While not a mind-blowing move, it is good to see that the Sundart Holdings Limited (HKG:1568) share price has gained 15% in the last three months. But spare a thought for the long term holders, who have held the stock as it bled value over the last five years. Five years have seen the share price descend precipitously, down a full 91%. So we don't gain too much confidence from the recent recovery. The real question is whether the business can leave its past behind and improve itself over the years ahead. We really feel for shareholders in this scenario. It's a good reminder of the importance of diversification, and it's worth keeping in mind there's more to life than money, anyway.
If the past week is anything to go by, investor sentiment for Sundart Holdings isn't positive, so let's see if there's a mismatch between fundamentals and the share price.
See our latest analysis for Sundart Holdings
While the efficient markets hypothesis continues to be taught by some, it has been proven that markets are over-reactive dynamic systems, and investors are not always rational. One way to examine how market sentiment has changed over time is to look at the interaction between a company's share price and its earnings per share (EPS).
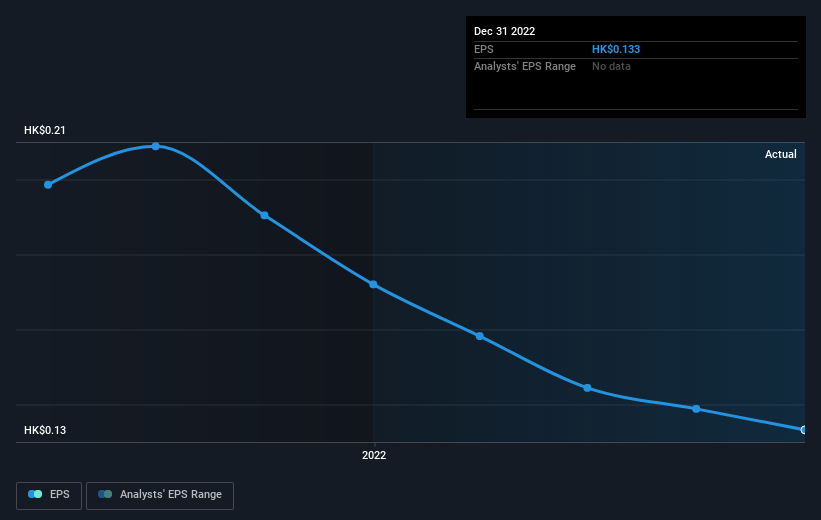
During the five years over which the share price declined, Sundart Holdings' earnings per share (EPS) dropped by 7.3% each year. This reduction in EPS is less than the 38% annual reduction in the share price. This implies that the market is more cautious about the business these days. The low P/E ratio of 2.89 further reflects this reticence.
The image below shows how EPS has tracked over time (if you click on the image you can see greater detail).
It might be well worthwhile taking a look at our free report on Sundart Holdings' earnings, revenue and cash flow.
What About Dividends?
It is important to consider the total shareholder return, as well as the share price return, for any given stock. The TSR incorporates the value of any spin-offs or discounted capital raisings, along with any dividends, based on the assumption that the dividends are reinvested. Arguably, the TSR gives a more comprehensive picture of the return generated by a stock. In the case of Sundart Holdings, it has a TSR of -87% for the last 5 years. That exceeds its share price return that we previously mentioned. And there's no prize for guessing that the dividend payments largely explain the divergence!
A Different Perspective
It's good to see that Sundart Holdings has rewarded shareholders with a total shareholder return of 15% in the last twelve months. That's including the dividend. That certainly beats the loss of about 13% per year over the last half decade. The long term loss makes us cautious, but the short term TSR gain certainly hints at a brighter future. I find it very interesting to look at share price over the long term as a proxy for business performance. But to truly gain insight, we need to consider other information, too. Consider for instance, the ever-present spectre of investment risk. We've identified 2 warning signs with Sundart Holdings (at least 1 which is potentially serious) , and understanding them should be part of your investment process.
But note: Sundart Holdings may not be the best stock to buy. So take a peek at this free list of interesting companies with past earnings growth (and further growth forecast).
Please note, the market returns quoted in this article reflect the market weighted average returns of stocks that currently trade on Hong Kong exchanges.
Valuation is complex, but we're helping make it simple.
Find out whether Sundart Holdings is potentially over or undervalued by checking out our comprehensive analysis, which includes fair value estimates, risks and warnings, dividends, insider transactions and financial health.
View the Free AnalysisHave feedback on this article? Concerned about the content? Get in touch with us directly. Alternatively, email editorial-team (at) simplywallst.com.
This article by Simply Wall St is general in nature. We provide commentary based on historical data and analyst forecasts only using an unbiased methodology and our articles are not intended to be financial advice. It does not constitute a recommendation to buy or sell any stock, and does not take account of your objectives, or your financial situation. We aim to bring you long-term focused analysis driven by fundamental data. Note that our analysis may not factor in the latest price-sensitive company announcements or qualitative material. Simply Wall St has no position in any stocks mentioned.
About SEHK:1568
Sundart Holdings
Sundart Holdings Limited, an investment holding company, provides fitting-out services in the People’s Republic of China, Hong Kong, Singapore, and Macau.
Flawless balance sheet and good value.

