Even though Vis Containers Manufacturing (ATH:VIS) has lost €3.2m market cap in last 7 days, shareholders are still up 115% over 5 years


These days it's easy to simply buy an index fund, and your returns should (roughly) match the market. But even in a market-beating portfolio, some stocks will lag the market. The Vis Containers Manufacturing Company S.A. (ATH:VIS) stock price is down 74% over five years, but the total shareholder return is 115% once you include the dividend. That's better than the market which returned 40% over the same time.
With the stock having lost 18% in the past week, it's worth taking a look at business performance and seeing if there's any red flags.
Check out our latest analysis for Vis Containers Manufacturing
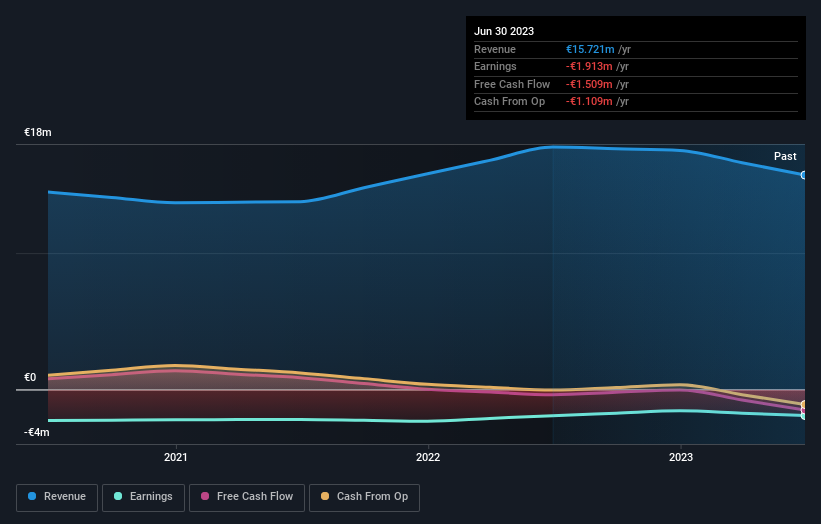
Vis Containers Manufacturing wasn't profitable in the last twelve months, it is unlikely we'll see a strong correlation between its share price and its earnings per share (EPS). Arguably revenue is our next best option. Shareholders of unprofitable companies usually expect strong revenue growth. Some companies are willing to postpone profitability to grow revenue faster, but in that case one does expect good top-line growth.
Over five years, Vis Containers Manufacturing grew its revenue at 0.2% per year. That's far from impressive given all the money it is losing. Nonetheless, it's fair to say the rapidly declining share price (down 12%, compound, over five years) suggests the market is very disappointed with this level of growth. We'd be pretty cautious about this one, although the sell-off may be too severe. We'd recommend focussing any further research on the likelihood of profitability in the foreseeable future, given the muted revenue growth.
The image below shows how earnings and revenue have tracked over time (if you click on the image you can see greater detail).
This free interactive report on Vis Containers Manufacturing's balance sheet strength is a great place to start, if you want to investigate the stock further.
What About The Total Shareholder Return (TSR)?
Investors should note that there's a difference between Vis Containers Manufacturing's total shareholder return (TSR) and its share price change, which we've covered above. The TSR attempts to capture the value of dividends (as if they were reinvested) as well as any spin-offs or discounted capital raisings offered to shareholders. We note that Vis Containers Manufacturing's TSR, at 115% is higher than its share price return of -74%. When you consider it hasn't been paying a dividend, this data suggests shareholders have benefitted from a spin-off, or had the opportunity to acquire attractively priced shares in a discounted capital raising.
A Different Perspective
We're pleased to report that Vis Containers Manufacturing shareholders have received a total shareholder return of 166% over one year. That's better than the annualised return of 17% over half a decade, implying that the company is doing better recently. In the best case scenario, this may hint at some real business momentum, implying that now could be a great time to delve deeper. I find it very interesting to look at share price over the long term as a proxy for business performance. But to truly gain insight, we need to consider other information, too. Consider for instance, the ever-present spectre of investment risk. We've identified 3 warning signs with Vis Containers Manufacturing (at least 2 which don't sit too well with us) , and understanding them should be part of your investment process.
Of course Vis Containers Manufacturing may not be the best stock to buy. So you may wish to see this free collection of growth stocks.
Please note, the market returns quoted in this article reflect the market weighted average returns of stocks that currently trade on Greek exchanges.
New: Manage All Your Stock Portfolios in One Place
We've created the ultimate portfolio companion for stock investors, and it's free.
• Connect an unlimited number of Portfolios and see your total in one currency
• Be alerted to new Warning Signs or Risks via email or mobile
• Track the Fair Value of your stocks
Have feedback on this article? Concerned about the content? Get in touch with us directly. Alternatively, email editorial-team (at) simplywallst.com.
This article by Simply Wall St is general in nature. We provide commentary based on historical data and analyst forecasts only using an unbiased methodology and our articles are not intended to be financial advice. It does not constitute a recommendation to buy or sell any stock, and does not take account of your objectives, or your financial situation. We aim to bring you long-term focused analysis driven by fundamental data. Note that our analysis may not factor in the latest price-sensitive company announcements or qualitative material. Simply Wall St has no position in any stocks mentioned.
About ATSE:VIS
Low and overvalued.

