
Advertisement
Fewer Investors Than Expected Jumping On Invibes Advertising N.V. (EPA:ALINV)
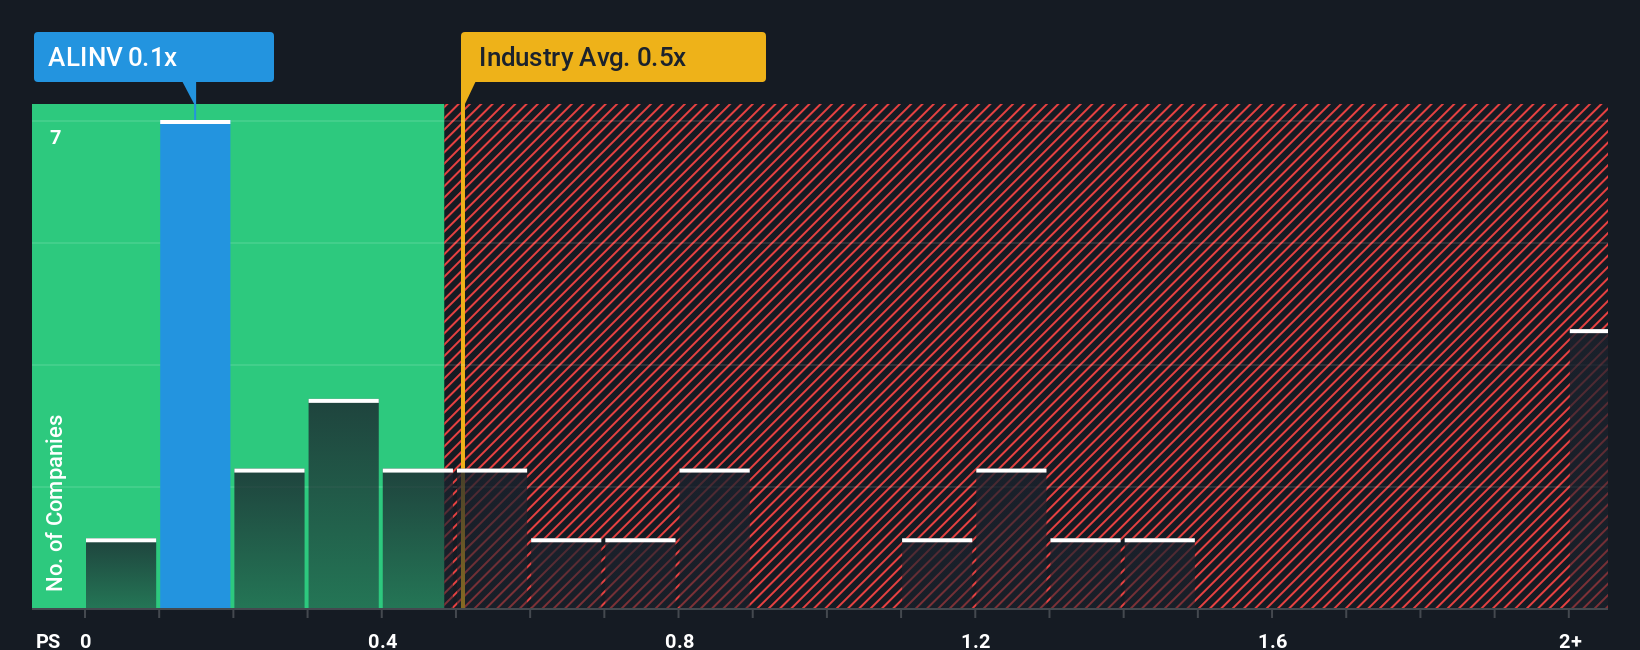
With a median price-to-sales (or "P/S") ratio of close to 0.5x in the Media industry in France, you could be forgiven for feeling indifferent about Invibes Advertising N.V.'s (EPA:ALINV) P/S ratio of 0.1x. However, investors might be overlooking a clear opportunity or potential setback if there is no rational basis for the P/S.
View our latest analysis for Invibes Advertising
What Does Invibes Advertising's P/S Mean For Shareholders?
As an illustration, revenue has deteriorated at Invibes Advertising over the last year, which is not ideal at all. Perhaps investors believe the recent revenue performance is enough to keep in line with the industry, which is keeping the P/S from dropping off. If you like the company, you'd at least be hoping this is the case so that you could potentially pick up some stock while it's not quite in favour.
We don't have analyst forecasts, but you can see how recent trends are setting up the company for the future by checking out our free report on Invibes Advertising's earnings, revenue and cash flow.Do Revenue Forecasts Match The P/S Ratio?
Invibes Advertising's P/S ratio would be typical for a company that's only expected to deliver moderate growth, and importantly, perform in line with the industry.
Taking a look back first, the company's revenue growth last year wasn't something to get excited about as it posted a disappointing decline of 7.9%. This has soured the latest three-year period, which nevertheless managed to deliver a decent 15% overall rise in revenue. Although it's been a bumpy ride, it's still fair to say the revenue growth recently has been mostly respectable for the company.
Comparing that to the industry, which is predicted to shrink 5.2% in the next 12 months, the company's positive momentum based on recent medium-term revenue results is a bright spot for the moment.
With this in mind, we find it intriguing that Invibes Advertising's P/S matches its industry peers. Apparently some shareholders believe the recent performance is at its limits and have been accepting lower selling prices.
The Bottom Line On Invibes Advertising's P/S
Typically, we'd caution against reading too much into price-to-sales ratios when settling on investment decisions, though it can reveal plenty about what other market participants think about the company.
As mentioned previously, Invibes Advertising currently trades on a P/S on par with the wider industry, but this is lower than expected considering its recent three-year revenue growth is beating forecasts for a struggling industry. When we see a history of positive growth in a struggling industry, but only an average P/S, we assume potential risks are what might be placing pressure on the P/S ratio. Without the guidance of analysts, perhaps shareholders are feeling uncertain over whether the revenue performance can continue amidst a declining industry outlook. The fact that the company's relative performance has not provided a kick to the share price suggests that some investors are anticipating revenue instability.
And what about other risks? Every company has them, and we've spotted 3 warning signs for Invibes Advertising (of which 2 shouldn't be ignored!) you should know about.
Of course, profitable companies with a history of great earnings growth are generally safer bets. So you may wish to see this free collection of other companies that have reasonable P/E ratios and have grown earnings strongly.
New: AI Stock Screener & Alerts
Our new AI Stock Screener scans the market every day to uncover opportunities.
• Dividend Powerhouses (3%+ Yield)
• Undervalued Small Caps with Insider Buying
• High growth Tech and AI Companies
Or build your own from over 50 metrics.
Have feedback on this article? Concerned about the content? Get in touch with us directly. Alternatively, email editorial-team (at) simplywallst.com.
This article by Simply Wall St is general in nature. We provide commentary based on historical data and analyst forecasts only using an unbiased methodology and our articles are not intended to be financial advice. It does not constitute a recommendation to buy or sell any stock, and does not take account of your objectives, or your financial situation. We aim to bring you long-term focused analysis driven by fundamental data. Note that our analysis may not factor in the latest price-sensitive company announcements or qualitative material. Simply Wall St has no position in any stocks mentioned.
About ENXTPA:ALINV
Invibes Advertising
A technology company, provides digital advertising services in Belgium and internationally.
Flawless balance sheet with low risk.
Market Insights

Advertisement
Community Narratives
The "Molecular Pencil": Why Beam's Technology is Built to Win
Fair Value US$65.01|65.4% undervalued
DA
Community Contributor
The silent giant behind virtually every advanced chip powering AI, smartphones, and modern infrastructure.
Fair Value US$310.00|6.1% undervalued
OS
Community Contributor
ADP Stock: Solid Fundamentals, But AI Investments Test Its Margin Resilience
Fair Value US$387.77|34.2% undervalued
YI
Community Contributor
MINISO's fair value is projected at 26.69 with an anticipated PE ratio shift of 20x
Fair Value US$24.03|9.6% undervalued
BE
Community Contributor