- China
- /
- Real Estate
- /
- SZSE:000736
CCCG Real Estate (SZSE:000736) delivers shareholders impressive 19% CAGR over 5 years, surging 22% in the last week alone


When you buy shares in a company, it's worth keeping in mind the possibility that it could fail, and you could lose your money. But when you pick a company that is really flourishing, you can make more than 100%. One great example is CCCG Real Estate Company Limited (SZSE:000736) which saw its share price drive 131% higher over five years. It's also up 63% in about a month.
Since the stock has added CN¥1.6b to its market cap in the past week alone, let's see if underlying performance has been driving long-term returns.
Check out our latest analysis for CCCG Real Estate
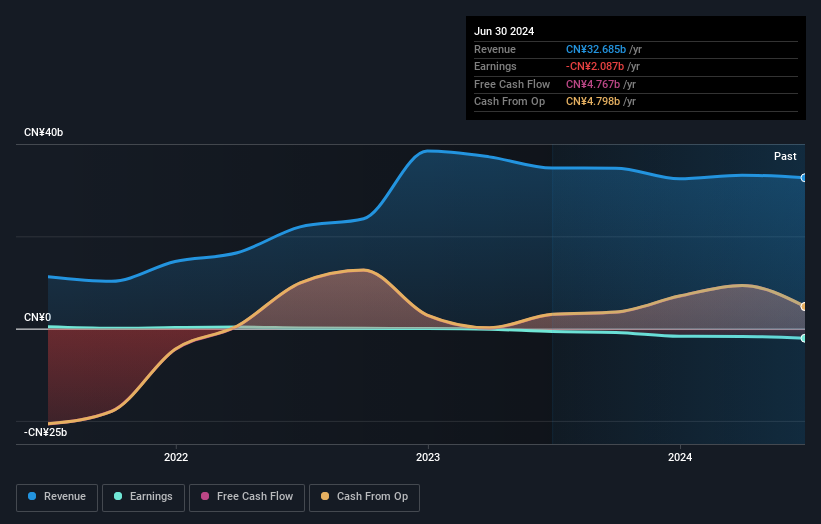
Because CCCG Real Estate made a loss in the last twelve months, we think the market is probably more focussed on revenue and revenue growth, at least for now. Shareholders of unprofitable companies usually desire strong revenue growth. That's because fast revenue growth can be easily extrapolated to forecast profits, often of considerable size.
For the last half decade, CCCG Real Estate can boast revenue growth at a rate of 28% per year. Even measured against other revenue-focussed companies, that's a good result. So it's not entirely surprising that the share price reflected this performance by increasing at a rate of 18% per year, in that time. So it seems likely that buyers have paid attention to the strong revenue growth. CCCG Real Estate seems like a high growth stock - so growth investors might want to add it to their watchlist.
You can see below how earnings and revenue have changed over time (discover the exact values by clicking on the image).
We're pleased to report that the CEO is remunerated more modestly than most CEOs at similarly capitalized companies. It's always worth keeping an eye on CEO pay, but a more important question is whether the company will grow earnings throughout the years. This free interactive report on CCCG Real Estate's earnings, revenue and cash flow is a great place to start, if you want to investigate the stock further.
What About The Total Shareholder Return (TSR)?
Investors should note that there's a difference between CCCG Real Estate's total shareholder return (TSR) and its share price change, which we've covered above. The TSR attempts to capture the value of dividends (as if they were reinvested) as well as any spin-offs or discounted capital raisings offered to shareholders. CCCG Real Estate's TSR of 136% for the 5 years exceeded its share price return, because it has paid dividends.
A Different Perspective
While it's never nice to take a loss, CCCG Real Estate shareholders can take comfort that their trailing twelve month loss of 7.9% wasn't as bad as the market loss of around 14%. Of course, the long term returns are far more important and the good news is that over five years, the stock has returned 19% for each year. It could be that the business is just facing some short term problems, but shareholders should keep a close eye on the fundamentals. It's always interesting to track share price performance over the longer term. But to understand CCCG Real Estate better, we need to consider many other factors. Consider for instance, the ever-present spectre of investment risk. We've identified 4 warning signs with CCCG Real Estate (at least 3 which are concerning) , and understanding them should be part of your investment process.
If you are like me, then you will not want to miss this free list of undervalued small caps that insiders are buying.
Please note, the market returns quoted in this article reflect the market weighted average returns of stocks that currently trade on Chinese exchanges.
New: AI Stock Screener & Alerts
Our new AI Stock Screener scans the market every day to uncover opportunities.
• Dividend Powerhouses (3%+ Yield)
• Undervalued Small Caps with Insider Buying
• High growth Tech and AI Companies
Or build your own from over 50 metrics.
Have feedback on this article? Concerned about the content? Get in touch with us directly. Alternatively, email editorial-team (at) simplywallst.com.
This article by Simply Wall St is general in nature. We provide commentary based on historical data and analyst forecasts only using an unbiased methodology and our articles are not intended to be financial advice. It does not constitute a recommendation to buy or sell any stock, and does not take account of your objectives, or your financial situation. We aim to bring you long-term focused analysis driven by fundamental data. Note that our analysis may not factor in the latest price-sensitive company announcements or qualitative material. Simply Wall St has no position in any stocks mentioned.
About SZSE:000736
CCCG Real Estate
Develops, operates, and sells real estate properties in China.
Good value slight.

