Sunflower Pharmaceutical GroupLtd's (SZSE:002737) three-year earnings growth trails the notable shareholder returns


Sunflower Pharmaceutical Group Co.,Ltd (SZSE:002737) shareholders might be concerned after seeing the share price drop 19% in the last quarter. But over three years, the returns would have left most investors smiling In fact, the company's share price bested the return of its market index in that time, posting a gain of 38%.
Since it's been a strong week for Sunflower Pharmaceutical GroupLtd shareholders, let's have a look at trend of the longer term fundamentals.
Check out our latest analysis for Sunflower Pharmaceutical GroupLtd
To quote Buffett, 'Ships will sail around the world but the Flat Earth Society will flourish. There will continue to be wide discrepancies between price and value in the marketplace...' One imperfect but simple way to consider how the market perception of a company has shifted is to compare the change in the earnings per share (EPS) with the share price movement.
During three years of share price growth, Sunflower Pharmaceutical GroupLtd achieved compound earnings per share growth of 14% per year. This EPS growth is higher than the 11% average annual increase in the share price. So one could reasonably conclude that the market has cooled on the stock. This cautious sentiment is reflected in its (fairly low) P/E ratio of 11.67.
The company's earnings per share (over time) is depicted in the image below (click to see the exact numbers).
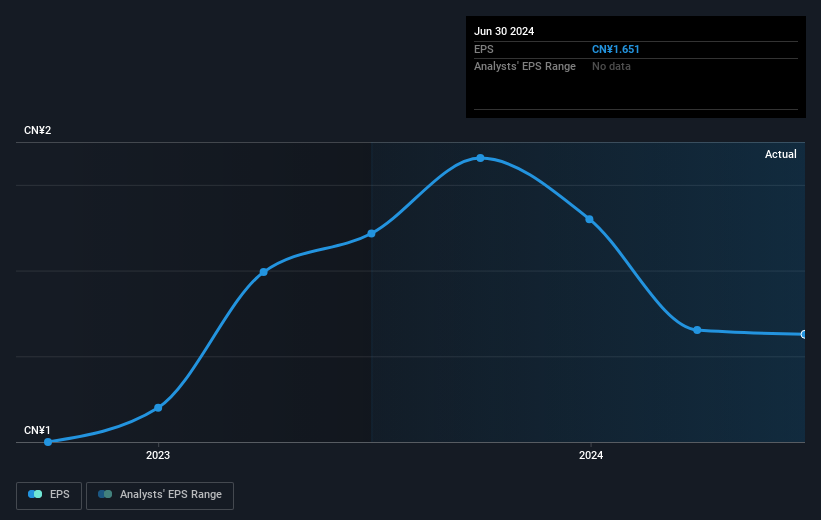
It might be well worthwhile taking a look at our free report on Sunflower Pharmaceutical GroupLtd's earnings, revenue and cash flow.
What About Dividends?
It is important to consider the total shareholder return, as well as the share price return, for any given stock. Whereas the share price return only reflects the change in the share price, the TSR includes the value of dividends (assuming they were reinvested) and the benefit of any discounted capital raising or spin-off. Arguably, the TSR gives a more comprehensive picture of the return generated by a stock. We note that for Sunflower Pharmaceutical GroupLtd the TSR over the last 3 years was 58%, which is better than the share price return mentioned above. And there's no prize for guessing that the dividend payments largely explain the divergence!
A Different Perspective
While it's certainly disappointing to see that Sunflower Pharmaceutical GroupLtd shares lost 15% throughout the year, that wasn't as bad as the market loss of 19%. Longer term investors wouldn't be so upset, since they would have made 11%, each year, over five years. It could be that the business is just facing some short term problems, but shareholders should keep a close eye on the fundamentals. It's always interesting to track share price performance over the longer term. But to understand Sunflower Pharmaceutical GroupLtd better, we need to consider many other factors. To that end, you should be aware of the 2 warning signs we've spotted with Sunflower Pharmaceutical GroupLtd .
We will like Sunflower Pharmaceutical GroupLtd better if we see some big insider buys. While we wait, check out this free list of undervalued stocks (mostly small caps) with considerable, recent, insider buying.
Please note, the market returns quoted in this article reflect the market weighted average returns of stocks that currently trade on Chinese exchanges.
New: Manage All Your Stock Portfolios in One Place
We've created the ultimate portfolio companion for stock investors, and it's free.
• Connect an unlimited number of Portfolios and see your total in one currency
• Be alerted to new Warning Signs or Risks via email or mobile
• Track the Fair Value of your stocks
Have feedback on this article? Concerned about the content? Get in touch with us directly. Alternatively, email editorial-team (at) simplywallst.com.
This article by Simply Wall St is general in nature. We provide commentary based on historical data and analyst forecasts only using an unbiased methodology and our articles are not intended to be financial advice. It does not constitute a recommendation to buy or sell any stock, and does not take account of your objectives, or your financial situation. We aim to bring you long-term focused analysis driven by fundamental data. Note that our analysis may not factor in the latest price-sensitive company announcements or qualitative material. Simply Wall St has no position in any stocks mentioned.
About SZSE:002737
Sunflower Pharmaceutical GroupLtd
Engages in the research and development, manufacturing, and marketing of Chinese patent medicines in China and internationally.
Flawless balance sheet and slightly overvalued.

