- China
- /
- Medical Equipment
- /
- SZSE:300396
Dirui Industrial Co.,Ltd.'s (SZSE:300396) Fundamentals Look Pretty Strong: Could The Market Be Wrong About The Stock?


With its stock down 27% over the past three months, it is easy to disregard Dirui IndustrialLtd (SZSE:300396). However, stock prices are usually driven by a company’s financial performance over the long term, which in this case looks quite promising. Particularly, we will be paying attention to Dirui IndustrialLtd's ROE today.
Return on equity or ROE is a key measure used to assess how efficiently a company's management is utilizing the company's capital. Simply put, it is used to assess the profitability of a company in relation to its equity capital.
See our latest analysis for Dirui IndustrialLtd
How To Calculate Return On Equity?
The formula for return on equity is:
Return on Equity = Net Profit (from continuing operations) ÷ Shareholders' Equity
So, based on the above formula, the ROE for Dirui IndustrialLtd is:
13% = CN¥279m ÷ CN¥2.1b (Based on the trailing twelve months to June 2024).
The 'return' is the income the business earned over the last year. One way to conceptualize this is that for each CN¥1 of shareholders' capital it has, the company made CN¥0.13 in profit.
Why Is ROE Important For Earnings Growth?
Thus far, we have learned that ROE measures how efficiently a company is generating its profits. Based on how much of its profits the company chooses to reinvest or "retain", we are then able to evaluate a company's future ability to generate profits. Assuming everything else remains unchanged, the higher the ROE and profit retention, the higher the growth rate of a company compared to companies that don't necessarily bear these characteristics.
Dirui IndustrialLtd's Earnings Growth And 13% ROE
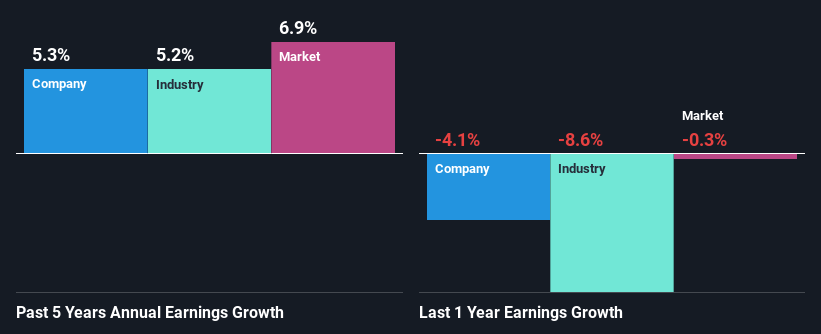
To begin with, Dirui IndustrialLtd seems to have a respectable ROE. Further, the company's ROE compares quite favorably to the industry average of 7.3%. This probably laid the ground for Dirui IndustrialLtd's moderate 5.3% net income growth seen over the past five years.
As a next step, we compared Dirui IndustrialLtd's net income growth with the industry and found that the company has a similar growth figure when compared with the industry average growth rate of 5.2% in the same period.
Earnings growth is a huge factor in stock valuation. It’s important for an investor to know whether the market has priced in the company's expected earnings growth (or decline). Doing so will help them establish if the stock's future looks promising or ominous. If you're wondering about Dirui IndustrialLtd's's valuation, check out this gauge of its price-to-earnings ratio, as compared to its industry.
Is Dirui IndustrialLtd Making Efficient Use Of Its Profits?
Dirui IndustrialLtd has a healthy combination of a moderate three-year median payout ratio of 49% (or a retention ratio of 51%) and a respectable amount of growth in earnings as we saw above, meaning that the company has been making efficient use of its profits.
Additionally, Dirui IndustrialLtd has paid dividends over a period of nine years which means that the company is pretty serious about sharing its profits with shareholders.
Conclusion
On the whole, we feel that Dirui IndustrialLtd's performance has been quite good. In particular, it's great to see that the company is investing heavily into its business and along with a high rate of return, that has resulted in a sizeable growth in its earnings. Having said that, looking at the current analyst estimates, we found that the company's earnings are expected to gain momentum. To know more about the company's future earnings growth forecasts take a look at this free report on analyst forecasts for the company to find out more.
New: Manage All Your Stock Portfolios in One Place
We've created the ultimate portfolio companion for stock investors, and it's free.
• Connect an unlimited number of Portfolios and see your total in one currency
• Be alerted to new Warning Signs or Risks via email or mobile
• Track the Fair Value of your stocks
Have feedback on this article? Concerned about the content? Get in touch with us directly. Alternatively, email editorial-team (at) simplywallst.com.
This article by Simply Wall St is general in nature. We provide commentary based on historical data and analyst forecasts only using an unbiased methodology and our articles are not intended to be financial advice. It does not constitute a recommendation to buy or sell any stock, and does not take account of your objectives, or your financial situation. We aim to bring you long-term focused analysis driven by fundamental data. Note that our analysis may not factor in the latest price-sensitive company announcements or qualitative material. Simply Wall St has no position in any stocks mentioned.
About SZSE:300396
Dirui IndustrialLtd
Engages in the research and development, production, and sale of medical inspection products in the People's Republic of China.
High growth potential with adequate balance sheet.

