The three-year shareholder returns and company earnings persist lower as FULONGMA GROUPLtd (SHSE:603686) stock falls a further 11% in past week


These days it's easy to simply buy an index fund, and your returns should (roughly) match the market. By comparison, an individual stock is unlikely to match market returns - and could well fall short. The FULONGMA GROUP Co.,Ltd. (SHSE:603686) is such an example; over three years its share price is down 40% versus a marketdecline of 31%. Even worse, it's down 17% in about a month, which isn't fun at all.
After losing 11% this past week, it's worth investigating the company's fundamentals to see what we can infer from past performance.
Check out our latest analysis for FULONGMA GROUPLtd
While markets are a powerful pricing mechanism, share prices reflect investor sentiment, not just underlying business performance. One flawed but reasonable way to assess how sentiment around a company has changed is to compare the earnings per share (EPS) with the share price.
During the three years that the share price fell, FULONGMA GROUPLtd's earnings per share (EPS) dropped by 23% each year. In comparison the 16% compound annual share price decline isn't as bad as the EPS drop-off. So the market may not be too worried about the EPS figure, at the moment -- or it may have previously priced some of the drop in.
The company's earnings per share (over time) is depicted in the image below (click to see the exact numbers).
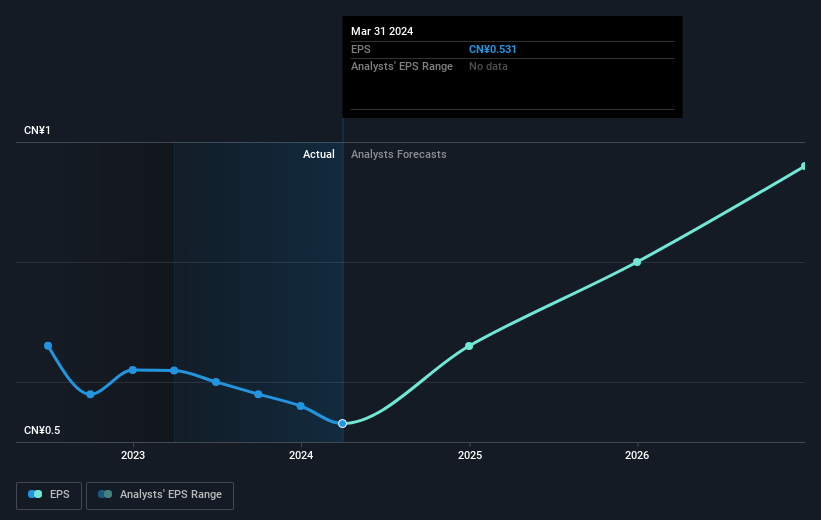
It might be well worthwhile taking a look at our free report on FULONGMA GROUPLtd's earnings, revenue and cash flow.
What About Dividends?
As well as measuring the share price return, investors should also consider the total shareholder return (TSR). The TSR incorporates the value of any spin-offs or discounted capital raisings, along with any dividends, based on the assumption that the dividends are reinvested. So for companies that pay a generous dividend, the TSR is often a lot higher than the share price return. In the case of FULONGMA GROUPLtd, it has a TSR of -35% for the last 3 years. That exceeds its share price return that we previously mentioned. This is largely a result of its dividend payments!
A Different Perspective
Although it hurts that FULONGMA GROUPLtd returned a loss of 9.5% in the last twelve months, the broader market was actually worse, returning a loss of 16%. Given the total loss of 4% per year over five years, it seems returns have deteriorated in the last twelve months. While some investors do well specializing in buying companies that are struggling (but nonetheless undervalued), don't forget that Buffett said that 'turnarounds seldom turn'. While it is well worth considering the different impacts that market conditions can have on the share price, there are other factors that are even more important. For instance, we've identified 1 warning sign for FULONGMA GROUPLtd that you should be aware of.
Of course, you might find a fantastic investment by looking elsewhere. So take a peek at this free list of companies we expect will grow earnings.
Please note, the market returns quoted in this article reflect the market weighted average returns of stocks that currently trade on Chinese exchanges.
New: AI Stock Screener & Alerts
Our new AI Stock Screener scans the market every day to uncover opportunities.
• Dividend Powerhouses (3%+ Yield)
• Undervalued Small Caps with Insider Buying
• High growth Tech and AI Companies
Or build your own from over 50 metrics.
Have feedback on this article? Concerned about the content? Get in touch with us directly. Alternatively, email editorial-team (at) simplywallst.com.
This article by Simply Wall St is general in nature. We provide commentary based on historical data and analyst forecasts only using an unbiased methodology and our articles are not intended to be financial advice. It does not constitute a recommendation to buy or sell any stock, and does not take account of your objectives, or your financial situation. We aim to bring you long-term focused analysis driven by fundamental data. Note that our analysis may not factor in the latest price-sensitive company announcements or qualitative material. Simply Wall St has no position in any stocks mentioned.
About SHSE:603686
Excellent balance sheet with moderate growth potential.

