- China
- /
- Auto Components
- /
- SZSE:002126
Is Zhejiang Yinlun Machinery Co.,Ltd.'s (SZSE:002126) Latest Stock Performance A Reflection Of Its Financial Health?


Zhejiang Yinlun MachineryLtd (SZSE:002126) has had a great run on the share market with its stock up by a significant 14% over the last month. Given the company's impressive performance, we decided to study its financial indicators more closely as a company's financial health over the long-term usually dictates market outcomes. Specifically, we decided to study Zhejiang Yinlun MachineryLtd's ROE in this article.
ROE or return on equity is a useful tool to assess how effectively a company can generate returns on the investment it received from its shareholders. Put another way, it reveals the company's success at turning shareholder investments into profits.
See our latest analysis for Zhejiang Yinlun MachineryLtd
How To Calculate Return On Equity?
The formula for return on equity is:
Return on Equity = Net Profit (from continuing operations) ÷ Shareholders' Equity
So, based on the above formula, the ROE for Zhejiang Yinlun MachineryLtd is:
12% = CN¥821m ÷ CN¥6.6b (Based on the trailing twelve months to June 2024).
The 'return' is the amount earned after tax over the last twelve months. That means that for every CN¥1 worth of shareholders' equity, the company generated CN¥0.12 in profit.
What Has ROE Got To Do With Earnings Growth?
Thus far, we have learned that ROE measures how efficiently a company is generating its profits. Based on how much of its profits the company chooses to reinvest or "retain", we are then able to evaluate a company's future ability to generate profits. Generally speaking, other things being equal, firms with a high return on equity and profit retention, have a higher growth rate than firms that don’t share these attributes.
Zhejiang Yinlun MachineryLtd's Earnings Growth And 12% ROE
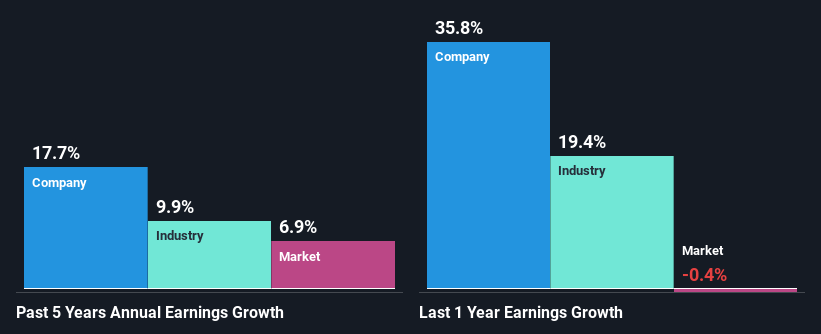
At first glance, Zhejiang Yinlun MachineryLtd seems to have a decent ROE. Especially when compared to the industry average of 8.5% the company's ROE looks pretty impressive. Probably as a result of this, Zhejiang Yinlun MachineryLtd was able to see a decent growth of 18% over the last five years.
As a next step, we compared Zhejiang Yinlun MachineryLtd's net income growth with the industry, and pleasingly, we found that the growth seen by the company is higher than the average industry growth of 9.9%.
Earnings growth is an important metric to consider when valuing a stock. The investor should try to establish if the expected growth or decline in earnings, whichever the case may be, is priced in. This then helps them determine if the stock is placed for a bright or bleak future. Has the market priced in the future outlook for 002126? You can find out in our latest intrinsic value infographic research report.
Is Zhejiang Yinlun MachineryLtd Using Its Retained Earnings Effectively?
In Zhejiang Yinlun MachineryLtd's case, its respectable earnings growth can probably be explained by its low three-year median payout ratio of 17% (or a retention ratio of 83%), which suggests that the company is investing most of its profits to grow its business.
Additionally, Zhejiang Yinlun MachineryLtd has paid dividends over a period of at least ten years which means that the company is pretty serious about sharing its profits with shareholders.
Summary
On the whole, we feel that Zhejiang Yinlun MachineryLtd's performance has been quite good. In particular, it's great to see that the company is investing heavily into its business and along with a high rate of return, that has resulted in a sizeable growth in its earnings. That being so, the latest analyst forecasts show that the company will continue to see an expansion in its earnings. To know more about the latest analysts predictions for the company, check out this visualization of analyst forecasts for the company.
Valuation is complex, but we're here to simplify it.
Discover if Zhejiang Yinlun MachineryLtd might be undervalued or overvalued with our detailed analysis, featuring fair value estimates, potential risks, dividends, insider trades, and its financial condition.
Access Free AnalysisHave feedback on this article? Concerned about the content? Get in touch with us directly. Alternatively, email editorial-team (at) simplywallst.com.
This article by Simply Wall St is general in nature. We provide commentary based on historical data and analyst forecasts only using an unbiased methodology and our articles are not intended to be financial advice. It does not constitute a recommendation to buy or sell any stock, and does not take account of your objectives, or your financial situation. We aim to bring you long-term focused analysis driven by fundamental data. Note that our analysis may not factor in the latest price-sensitive company announcements or qualitative material. Simply Wall St has no position in any stocks mentioned.
About SZSE:002126
Zhejiang Yinlun MachineryLtd
Researches, develops, manufactures, and sells thermal management and exhaust gas after-treatment products.
Undervalued with solid track record.

