
Advertisement
- Canada
- /
- Real Estate
- /
- TSX:MEQ
Does This Valuation Of Mainstreet Equity Corp. (TSE:MEQ) Imply Investors Are Overpaying?

Key Insights
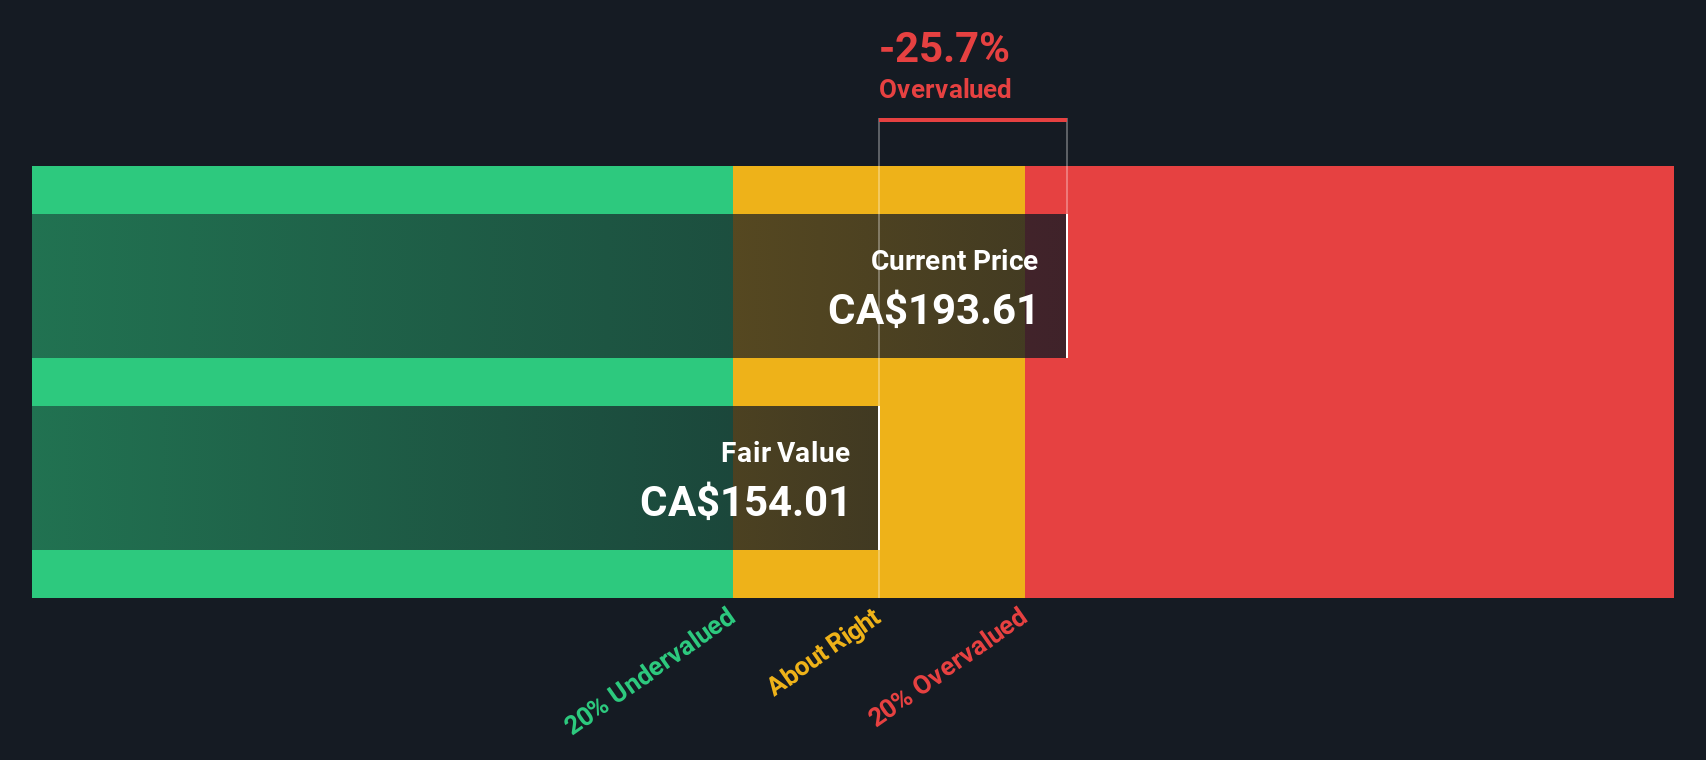
- Using the 2 Stage Free Cash Flow to Equity, Mainstreet Equity fair value estimate is CA$154
- Mainstreet Equity's CA$194 share price signals that it might be 26% overvalued
- When compared to theindustry average discount of -62%, Mainstreet Equity's competitors seem to be trading at a greater premium to fair value
Does the August share price for Mainstreet Equity Corp. (TSE:MEQ) reflect what it's really worth? Today, we will estimate the stock's intrinsic value by taking the expected future cash flows and discounting them to their present value. One way to achieve this is by employing the Discounted Cash Flow (DCF) model. Before you think you won't be able to understand it, just read on! It's actually much less complex than you'd imagine.
Companies can be valued in a lot of ways, so we would point out that a DCF is not perfect for every situation. If you want to learn more about discounted cash flow, the rationale behind this calculation can be read in detail in the Simply Wall St analysis model.
What's The Estimated Valuation?
We're using the 2-stage growth model, which simply means we take in account two stages of company's growth. In the initial period the company may have a higher growth rate and the second stage is usually assumed to have a stable growth rate. To start off with, we need to estimate the next ten years of cash flows. Where possible we use analyst estimates, but when these aren't available we extrapolate the previous free cash flow (FCF) from the last estimate or reported value. We assume companies with shrinking free cash flow will slow their rate of shrinkage, and that companies with growing free cash flow will see their growth rate slow, over this period. We do this to reflect that growth tends to slow more in the early years than it does in later years.
A DCF is all about the idea that a dollar in the future is less valuable than a dollar today, and so the sum of these future cash flows is then discounted to today's value:
10-year free cash flow (FCF) forecast
| 2026 | 2027 | 2028 | 2029 | 2030 | 2031 | 2032 | 2033 | 2034 | 2035 | |
| Levered FCF (CA$, Millions) | CA$96.3m | CA$101.1m | CA$105.3m | CA$109.3m | CA$113.0m | CA$116.6m | CA$120.1m | CA$123.5m | CA$127.0m | CA$130.4m |
| Growth Rate Estimate Source | Analyst x1 | Est @ 4.94% | Est @ 4.24% | Est @ 3.75% | Est @ 3.40% | Est @ 3.16% | Est @ 2.99% | Est @ 2.88% | Est @ 2.79% | Est @ 2.73% |
| Present Value (CA$, Millions) Discounted @ 9.7% | CA$87.8 | CA$83.9 | CA$79.7 | CA$75.4 | CA$71.0 | CA$66.8 | CA$62.7 | CA$58.8 | CA$55.1 | CA$51.6 |
("Est" = FCF growth rate estimated by Simply Wall St)
Present Value of 10-year Cash Flow (PVCF) = CA$693m
We now need to calculate the Terminal Value, which accounts for all the future cash flows after this ten year period. For a number of reasons a very conservative growth rate is used that cannot exceed that of a country's GDP growth. In this case we have used the 5-year average of the 10-year government bond yield (2.6%) to estimate future growth. In the same way as with the 10-year 'growth' period, we discount future cash flows to today's value, using a cost of equity of 9.7%.
Terminal Value (TV)= FCF2035 × (1 + g) ÷ (r – g) = CA$130m× (1 + 2.6%) ÷ (9.7%– 2.6%) = CA$1.9b
Present Value of Terminal Value (PVTV)= TV / (1 + r)10= CA$1.9b÷ ( 1 + 9.7%)10= CA$742m
The total value, or equity value, is then the sum of the present value of the future cash flows, which in this case is CA$1.4b. In the final step we divide the equity value by the number of shares outstanding. Compared to the current share price of CA$194, the company appears slightly overvalued at the time of writing. Remember though, that this is just an approximate valuation, and like any complex formula - garbage in, garbage out.
Important Assumptions
We would point out that the most important inputs to a discounted cash flow are the discount rate and of course the actual cash flows. You don't have to agree with these inputs, I recommend redoing the calculations yourself and playing with them. The DCF also does not consider the possible cyclicality of an industry, or a company's future capital requirements, so it does not give a full picture of a company's potential performance. Given that we are looking at Mainstreet Equity as potential shareholders, the cost of equity is used as the discount rate, rather than the cost of capital (or weighted average cost of capital, WACC) which accounts for debt. In this calculation we've used 9.7%, which is based on a levered beta of 1.693. Beta is a measure of a stock's volatility, compared to the market as a whole. We get our beta from the industry average beta of globally comparable companies, with an imposed limit between 0.8 and 2.0, which is a reasonable range for a stable business.
See our latest analysis for Mainstreet Equity
SWOT Analysis for Mainstreet Equity
Strength
- Earnings growth over the past year exceeded the industry.
Weakness
- Interest payments on debt are not well covered.
- Dividend is low compared to the top 25% of dividend payers in the Real Estate market.
- Current share price is above our estimate of fair value.
Opportunity
- MEQ's financial characteristics indicate limited near-term opportunities for shareholders.
Threat
- Debt is not well covered by operating cash flow.
Moving On:
Valuation is only one side of the coin in terms of building your investment thesis, and it is only one of many factors that you need to assess for a company. It's not possible to obtain a foolproof valuation with a DCF model. Rather it should be seen as a guide to "what assumptions need to be true for this stock to be under/overvalued?" If a company grows at a different rate, or if its cost of equity or risk free rate changes sharply, the output can look very different. Why is the intrinsic value lower than the current share price? For Mainstreet Equity, there are three essential elements you should further examine:
- Risks: Case in point, we've spotted 2 warning signs for Mainstreet Equity you should be aware of, and 1 of them is a bit concerning.
- Future Earnings: How does MEQ's growth rate compare to its peers and the wider market? Dig deeper into the analyst consensus number for the upcoming years by interacting with our free analyst growth expectation chart.
- Other High Quality Alternatives: Do you like a good all-rounder? Explore our interactive list of high quality stocks to get an idea of what else is out there you may be missing!
PS. Simply Wall St updates its DCF calculation for every Canadian stock every day, so if you want to find the intrinsic value of any other stock just search here.
New: Manage All Your Stock Portfolios in One Place
We've created the ultimate portfolio companion for stock investors, and it's free.
• Connect an unlimited number of Portfolios and see your total in one currency
• Be alerted to new Warning Signs or Risks via email or mobile
• Track the Fair Value of your stocks
Have feedback on this article? Concerned about the content? Get in touch with us directly. Alternatively, email editorial-team (at) simplywallst.com.
This article by Simply Wall St is general in nature. We provide commentary based on historical data and analyst forecasts only using an unbiased methodology and our articles are not intended to be financial advice. It does not constitute a recommendation to buy or sell any stock, and does not take account of your objectives, or your financial situation. We aim to bring you long-term focused analysis driven by fundamental data. Note that our analysis may not factor in the latest price-sensitive company announcements or qualitative material. Simply Wall St has no position in any stocks mentioned.
About TSX:MEQ
Mainstreet Equity
Engages in the acquisition, redevelopment, repositioning, and management of mid-market residential rental apartment buildings in Western Canada.
Proven track record with low risk.
Market Insights

Advertisement
Community Narratives
Finding The True Value Of A Logistics Powerhouse
Fair Value US$95.21|8.4% undervalued
NV
Community Contributor
Paradigm Biopharmaceuticals Will Lead Osteoarthritis Treatment with Zilosul's FDA Success
Fair Value AU$5.50|92.1% undervalued
AM
Community Contributor
Barrick Mining (ABX:CA): A Gold Hedge against a U.S. Shutdown
Fair Value CA$60.00|24.2% undervalued
GM
Community Contributor