Advertisement
- Canada
- /
- Metals and Mining
- /
- TSX:FNV
Assessing Franco-Nevada After a 52% Rally and Renewed Gold Deal Momentum

Simply Wall St
Reviewed by Bailey Pemberton
- Wondering if Franco-Nevada is the bargain everyone’s searching for, or all priced in? Here is a breakdown of what’s really happening with this gold royalty giant.
- Franco-Nevada’s stock price has soared by 52.1% year-to-date but pulled back 14.2% over the past month, showing how quickly momentum and sentiment can shift.
- Recent headlines spotlighted renewed investor optimism in gold-linked assets and several high-profile royalty deals that have put Franco-Nevada in the spotlight. Industry discussion on gold price resilience and strategic acquisitions have played a significant role in fueling volatility and renewed interest.
- Looking at the numbers, Franco-Nevada scores just 1 out of 6 on our undervaluation checks. Up next, we will walk through the common methods used to value a stock like this, and then show you why there might be an even smarter way to make the call by the end of this article.
Franco-Nevada scores just 1/6 on our valuation checks. See what other red flags we found in the full valuation breakdown.
Approach 1: Franco-Nevada Discounted Cash Flow (DCF) Analysis
The Discounted Cash Flow (DCF) model works by projecting a company's future cash flows and then discounting those payments back to their value today. This provides an estimate of what the business is truly worth. For Franco-Nevada, the current Free Cash Flow stands at $32.91 million. Analysts provide annual cash flow estimates for up to five years. To look further into the future, projections are extrapolated beyond that by data providers such as Simply Wall St.
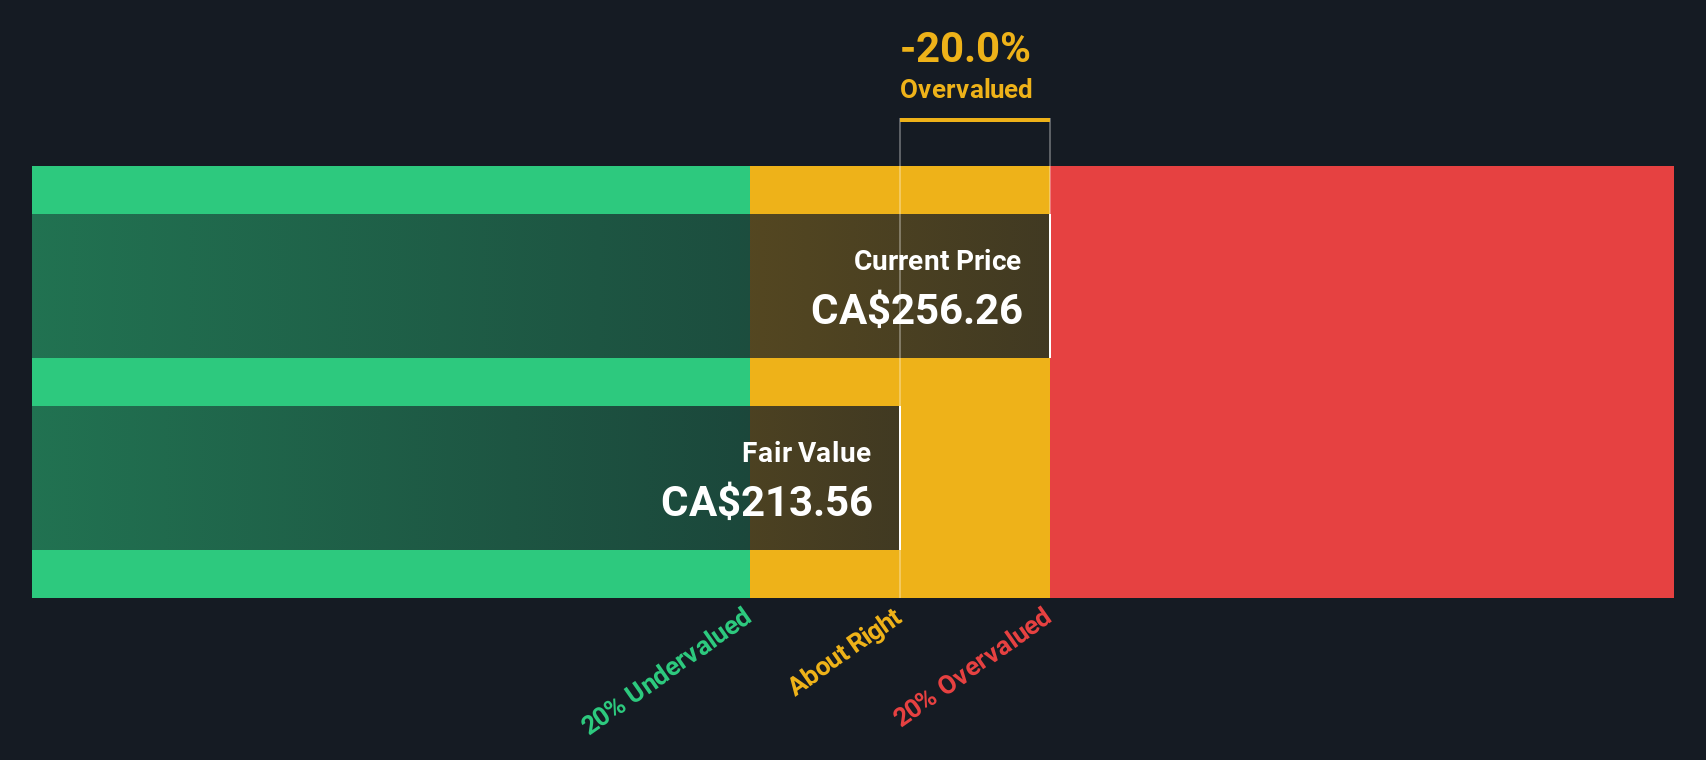
According to these forecasts, Franco-Nevada's Free Cash Flow is expected to climb to $1.45 billion by 2035, demonstrating significant anticipated growth despite some variability in yearly values. After running these figures through the DCF model, the estimated intrinsic value of the company comes to $206.99 per share.
When comparing this calculated value to Franco-Nevada’s current market price, the model suggests the stock is trading at a 28.2% premium. In other words, based on this cash flow model, Franco-Nevada shares appear to be overvalued.
Result: OVERVALUED
Our Discounted Cash Flow (DCF) analysis suggests Franco-Nevada may be overvalued by 28.2%. Discover 848 undervalued stocks or create your own screener to find better value opportunities.
Approach 2: Franco-Nevada Price vs Earnings
The Price-to-Earnings (PE) ratio is a popular and practical tool for evaluating profitable companies like Franco-Nevada. This metric helps investors understand how much they are paying for each dollar of a company’s earnings, which is especially meaningful when a business has consistent profits.
Not all PE ratios are created equal. Companies with higher expected growth or lower risks often justify a higher PE, while slower-growing or riskier firms usually trade at lower multiples. It is important to compare Franco-Nevada’s PE in context, rather than in isolation.
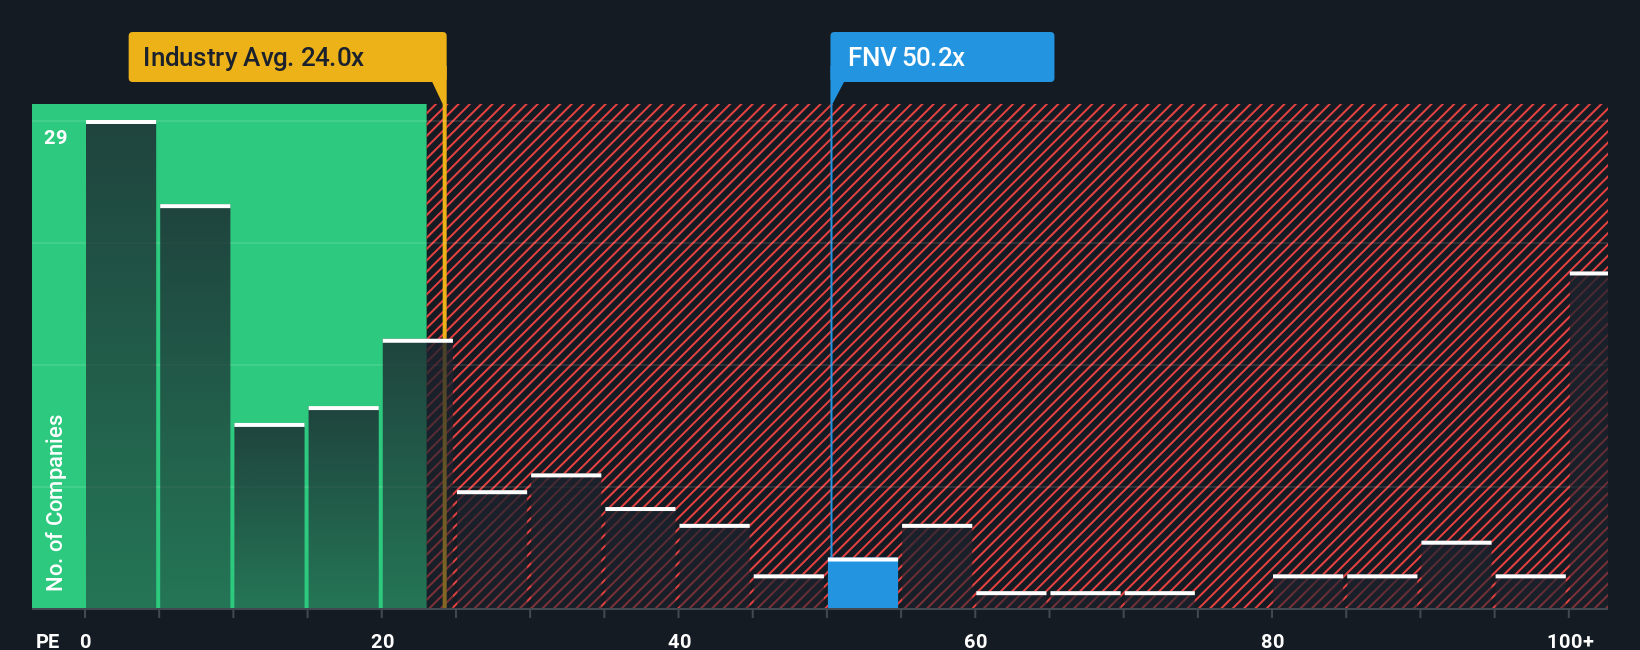
Currently, Franco-Nevada trades at a PE ratio of 39.4x. For perspective, the average among its direct peers sits at 30.8x, and the broader Metals and Mining industry average is even lower at 20.4x. This suggests the market is willing to pay a sizable premium for Franco-Nevada compared to other gold royalty businesses.
However, the Simply Wall St Fair Ratio for Franco-Nevada is 27.3x. Unlike standard industry or peer comparisons, the Fair Ratio is tailored to the company’s own earnings growth outlook, profit margin, size, and risk profile. This gives investors a more accurate sense of what would constitute a reasonable PE for Franco-Nevada, based on fundamentals that matter most.
Because Franco-Nevada’s actual PE of 39.4x is notably higher than its Fair Ratio of 27.3x, the valuation looks stretched by this measure.
Result: OVERVALUED
PE ratios tell one story, but what if the real opportunity lies elsewhere? Discover 1407 companies where insiders are betting big on explosive growth.
Upgrade Your Decision Making: Choose your Franco-Nevada Narrative
Earlier we mentioned that there is an even better way to understand valuation, so let us introduce you to Narratives. A Narrative is the story behind your numbers. It is your own perspective on Franco-Nevada’s future, including the reasons for your fair value estimate and your expectations for revenue, earnings, and profit margins.
This approach links the company’s business journey to a financial forecast, and then directly to a fair value you can act on. Narratives are quick and accessible on Simply Wall St’s Community page, used by millions of investors, where anyone can build, view, or challenge these custom investment stories.
Narratives help you decide when to buy or sell by clearly showing the gap between fair value and the current price. They are kept up to date whenever new information such as earnings announcements or breaking news comes in, ensuring your investment story stays relevant.
For example, some investors currently project Franco-Nevada is worth as much as CA$313.25, based on optimistic gold prices and margin expansion, while others see a fair value closer to CA$264.96 due to risks like asset concentration and regulatory challenges. Narratives allow you to see, compare, and easily update these viewpoints as the facts change, so you can make smarter, more informed decisions.
Do you think there's more to the story for Franco-Nevada? Head over to our Community to see what others are saying!

This article by Simply Wall St is general in nature. We provide commentary based on historical data and analyst forecasts only using an unbiased methodology and our articles are not intended to be financial advice. It does not constitute a recommendation to buy or sell any stock, and does not take account of your objectives, or your financial situation. We aim to bring you long-term focused analysis driven by fundamental data. Note that our analysis may not factor in the latest price-sensitive company announcements or qualitative material. Simply Wall St has no position in any stocks mentioned.
New: AI Stock Screener & Alerts
Our new AI Stock Screener scans the market every day to uncover opportunities.
• Dividend Powerhouses (3%+ Yield)
• Undervalued Small Caps with Insider Buying
• High growth Tech and AI Companies
Or build your own from over 50 metrics.
Have feedback on this article? Concerned about the content? Get in touch with us directly. Alternatively, email editorial-team@simplywallst.com
About TSX:FNV
Franco-Nevada
Operates as a royalty and stream company focused on precious metals in South America, Central America, Mexico, the United States, Canada, Australia, Europe, and internationally.
Flawless balance sheet with moderate growth potential.
Similar Companies
Market Insights

Advertisement
Community Narratives
The "Molecular Pencil": Why Beam's Technology is Built to Win
Fair Value US$65.01|65.4% undervalued
DA
Community Contributor
The silent giant behind virtually every advanced chip powering AI, smartphones, and modern infrastructure.
Fair Value US$310.00|6.1% undervalued
OS
Community Contributor
ADP Stock: Solid Fundamentals, But AI Investments Test Its Margin Resilience
Fair Value US$387.77|34.2% undervalued
YI
Community Contributor
MINISO's fair value is projected at 26.69 with an anticipated PE ratio shift of 20x
Fair Value US$24.03|9.6% undervalued
BE
Community Contributor