Stock Analysis

One of the best investments we can make is in our own knowledge and skill set. With that in mind, this article will work through how we can use Return On Equity (ROE) to better understand a business. To keep the lesson grounded in practicality, we'll use ROE to better understand Lynch Group Holdings Limited (ASX:LGL).
Return on equity or ROE is an important factor to be considered by a shareholder because it tells them how effectively their capital is being reinvested. Simply put, it is used to assess the profitability of a company in relation to its equity capital.
View our latest analysis for Lynch Group Holdings
How To Calculate Return On Equity?
The formula for return on equity is:
Return on Equity = Net Profit (from continuing operations) ÷ Shareholders' Equity
So, based on the above formula, the ROE for Lynch Group Holdings is:
2.8% = AU$6.4m ÷ AU$230m (Based on the trailing twelve months to January 2023).
The 'return' is the amount earned after tax over the last twelve months. Another way to think of that is that for every A$1 worth of equity, the company was able to earn A$0.03 in profit.
Does Lynch Group Holdings Have A Good ROE?
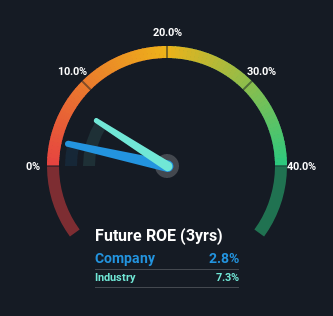
One simple way to determine if a company has a good return on equity is to compare it to the average for its industry. The limitation of this approach is that some companies are quite different from others, even within the same industry classification. As is clear from the image below, Lynch Group Holdings has a lower ROE than the average (7.3%) in the Food industry.
That's not what we like to see. That being said, a low ROE is not always a bad thing, especially if the company has low leverage as this still leaves room for improvement if the company were to take on more debt. When a company has low ROE but high debt levels, we would be cautious as the risk involved is too high.
Why You Should Consider Debt When Looking At ROE
Companies usually need to invest money to grow their profits. The cash for investment can come from prior year profits (retained earnings), issuing new shares, or borrowing. In the first two cases, the ROE will capture this use of capital to grow. In the latter case, the debt required for growth will boost returns, but will not impact the shareholders' equity. That will make the ROE look better than if no debt was used.
Lynch Group Holdings' Debt And Its 2.8% ROE
While Lynch Group Holdings does have some debt, with a debt to equity ratio of just 0.24, we wouldn't say debt is excessive. Its ROE is quite low, and the company already has some debt, so surely shareholders are hoping for an improvement. Judicious use of debt to improve returns can certainly be a good thing, although it does elevate risk slightly and reduce future optionality.
Summary
Return on equity is one way we can compare its business quality of different companies. In our books, the highest quality companies have high return on equity, despite low debt. If two companies have around the same level of debt to equity, and one has a higher ROE, I'd generally prefer the one with higher ROE.
Having said that, while ROE is a useful indicator of business quality, you'll have to look at a whole range of factors to determine the right price to buy a stock. Profit growth rates, versus the expectations reflected in the price of the stock, are a particularly important to consider. So you might want to check this FREE visualization of analyst forecasts for the company.
If you would prefer check out another company -- one with potentially superior financials -- then do not miss this free list of interesting companies, that have HIGH return on equity and low debt.
Valuation is complex, but we're helping make it simple.
Find out whether Lynch Group Holdings is potentially over or undervalued by checking out our comprehensive analysis, which includes fair value estimates, risks and warnings, dividends, insider transactions and financial health.
View the Free AnalysisHave feedback on this article? Concerned about the content? Get in touch with us directly. Alternatively, email editorial-team (at) simplywallst.com.
This article by Simply Wall St is general in nature. We provide commentary based on historical data and analyst forecasts only using an unbiased methodology and our articles are not intended to be financial advice. It does not constitute a recommendation to buy or sell any stock, and does not take account of your objectives, or your financial situation. We aim to bring you long-term focused analysis driven by fundamental data. Note that our analysis may not factor in the latest price-sensitive company announcements or qualitative material. Simply Wall St has no position in any stocks mentioned.
About ASX:LGL
Lynch Group Holdings
Lynch Group Holdings Limited operates as a grower, wholesaler, retailer, and importer of flowers and potted plants in Australia and China.
Reasonable growth potential with adequate balance sheet.

