
Last Update 14 Nov 24
Fair value Increased 0.11%Amazon Is Building The Platform To Compete For Advertising Spend
- Amazon grew TTM revenues by 12% and maintains strong performance driven by AWS.
- The company’s e-comm business is decelerating given rising competitors, its sheer market share and existing revenue base.
- In my view, Amazon’s key growth drivers will be AWS and advertising, the latter of which is increasingly limiting Google growth.
- By extending my forecasts from 2028 to 2029, my fair value for AMZN grew to $161 per share.
- While edge technologies like Kuiper and robotics may open new growth opportunities, it is too early to include them in a present value analysis.
Amazon’s trailing 12-month revenues grew close to 12% to $620B, 3rd quarter sales grew 11% to $159B. AWS was the key growth driver, increasing 19% to $27.5B, and now makes up 17% of the net revenues. The company is well underway to reaching my 2028 revenue forecast of $809B, and is ahead of my 8.5% annual revenue growth estimates.
Online stores were the lowest growing segment with 7.2%, indicating some difficulty for adding sales to the large $61B quarterly base.
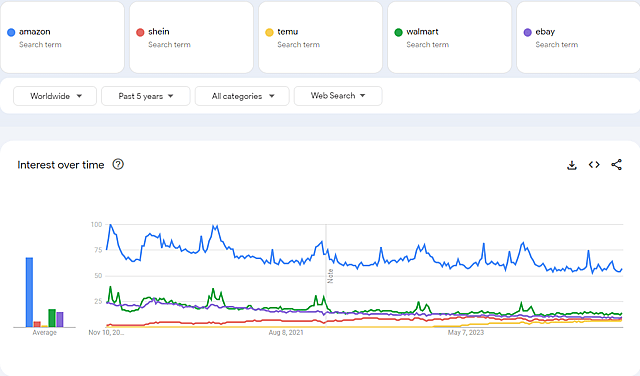
Google Trends: search queries for Amazon vs peers
The chart above shows that the company is facing increased competition, indicating that Amazon will need to defend its e-comm market share, rather than focusing on growth.
For the next quarter, management has guided a revenue growth rate between 7% and 11%, up to $188.5B. I expect the company to attain its mid to high-end of its internal estimates, but am not yet moving to change my top-line 2028 target of $809B. I discuss Amazon's growth opportunities, capex spend and efforts to optimize profitability below.
Amazon Demonstrates A Sustained Improvement To It’s Bottom-Line
Operating income rose to $60.6B up 130% on a TTM basis, practically confirming Amazon’s dedication to optimize the bottom-line. The company has now begun to successfully leverage its market share in order to scale up profitability. Amazon has also been working internally in this field and the company is implementing a series of steps to remove bureaucracy, leading to a decreased employee count, including removing middle-management positions. Shifting the story from growth to profitability will likely continue to have effects on the employment structure. In a “growth” scenario, most tech companies sought to acquire talent not because it was necessarily essential, but because they wanted to limit the access to talent for competitors. In the new “profitability” approach, tech companies are seeking to optimize costs. This leads to an over-correction on the side of reducing employees & projects, which has the effect of reducing salary expectations for new and existing team members. This is partly why AMZN can now better manage dilution via stock-based compensation (p. 15).
New Infrastructure CapEx Spend Will Be A Key Growth Driver
While optimizing profitability may take away some of the growth potential, Amazon is tackling this by continuing to reinvest into infrastructure capex. The CEO noted that AMZN plans to spend $75B on capex in 2024, and suspects that the company will spend more in 2025. Most of the rise in spend is due to generative AI.
Should Amazon continue reinvesting at the elevated rate, then a higher sustained growth rate may be possible and I will revise my revenue growth forecasts upwards. In my view, the company is intensely working on decreasing their reliance on NVIDIA chips, and developing internal solutions will reduce the future chip infrastructure spend. Amazon launched optimized EC2 instances based on their latest Gravitron4 processor, delivering 75% more memory bandwidth, and 30% better compute, than the previous generation.
While most of the infrastructure spend is aimed at generative AI, this doesn’t necessarily mean that it is a failed investment should AI demand flatten in the period ahead. Amazon AWS is primarily a cloud service and can easily reorient the new capacity into general compute needs.
Growth Verticals And Edge Technologies Maintain Investor Enthusiasm
Amazon’s Q3 advertising revenue grew almost 19% to $14.3B, and subscriptions (Prime) increased 11% to $11.3B.
Prime seems to have been knocked down in the earnings release priority list, with the only notable info being that the LOTR series is getting a second season. While there is no important flagship news in this area, I still consider that the total Prime package has the largest value proposition of all streamers and anticipate Amazon to keep growing their share among media competitors.
Advertising is a different story, and perhaps one of the largest growth verticals for the company after AWS. The appeal for advertisers lies in the change of shopping behavior in the last few years, where many new users have been onboarded to the platform and now directly search for products on Amazon. This is in contrast to the past, where fewer people were direct users, tended to start their search queries on Google, and ending up on Amazon after seeing organic search results or ads for products listed on Amazon. This means that the world of online advertising spend is segmenting into physical products and services. While Google held dominance in both areas in the past, it now increasingly has to share customers’ advertising spend with Amazon. In my opinion, advertisers will keep both their Google and Amazon advertising channels, but will allocate a lower portion of their budgets on Google, leading to a growth in advertising revenue and margins for Amazon.
Amazon’s edge technologies like project Kuiper and robotics keep developing, but it is too early to incorporate them into a financial forecast. While Tesla is pitching autonomous robots as a consumer product, Amazon seems to have a much more focused approach and is working on specialized robots that can be used in warehouses. I believe that Amazon has the right approach and higher likelihood to make a viable product, however this vision also limits the media buzz that the project generates and Tesla’s equity may be the one initially benefiting.
Valuation Implications
Despite the strong performance of Amazon in the past few quarters, I am maintaining my 2028 revenue estimate at $809B given the sheer size of the company’s base revenues and market share. I anticipate that the strongest continued growth avenues will be AWS and advertising.
However, just by extending my forecasts to 2029 using a 8.5% revenue CAGR I get revenues of $878B for Amazon. Using my 10% net profit margin and a forward PE of 27x, I arrive at a future value of $2.37T for Amazon. Discounted back to today using a 7% rate, I get a present value of $1.7T or $161 per share.
Key Takeaways
- Core retail business facing limited expansion room, already has a significant market share in the U.S.
- Ad and streaming businesses are growing and have the potential to be major drivers of future growth.
- The ad business is well-positioned to capitalize on the growth of e-commerce.
- Prime Video provides a better value than Netflix, may become the streaming leader in the U.S.
Catalysts
Company Catalysts
Amazon Outperforms, Driving Up Market Exuberance
The company operates across 7 segments and delivered impressive Q2 results. However, this may be the market’s throwback to the high performing years and the stock price gain seems based mostly on growth. Let’s recap segment performance:
- Online stores, 39.4% of revenue - growing at 4.15%. Amazon’s main online retail business.
- Physical stores, 3.7% of revenue - growing at 6.41%. e.g. Whole Foods, etc.
- Third-party sellers, 24% of revenue - growing at 18.1%. These sellers use Amazon to sell their products. The company monetizes them via commissions, fees, services, etc.
- Subscription services, 7.3% of revenue - growing at 13.5%. Includes Amazon Prime Video - the company’s streaming service.
- Advertising, 8% of revenue - growing at 22.6%. Consist of advertising services on Amazon’s platform, mostly to 3rd party sellers.
- AWS, 16.5% of revenue - growing at 12.2%, with a 24.2% Q2 operating margin. Amazon’s cloud infrastructure business. Looking back, AWS grew 15.8% YoY in Q1, and 29% in 2022.
- Other, 1% of revenue - growing at 25.6%.
Management also outlined that they expect Q3 net sales to be between $138B and $143B, and grow between 9% and 13% compared with third quarter 2022. Operating income is expected to be between $5.5B and $8.5B, compared with $2.5B in Q3 2022. Should the midpoint growth in operating income realize, we will see a $7B print which would be up 180% YoY, and shift the EV/EBIT multiple to 53.5x down from the current 95X.
The company is also cutting projects that failed to deliver and focusing on optimizing their cost structure. Repeated iterations are baked into the business model of the company, and it’s generally positive to see that Amazon is focusing on what works instead of accumulating sunk costs. The terminated projects include bookstores, 4 Star stores, Amazon care, Amazon Fabric. The company further terminated 27K corporate roles.
While the company positively surprised investors, I will review each key segment before estimating a fair value for Amazon.
Core Business Has Limited Expansion Room
Amazon is executing on delivery speed and volume, as more than half of Prime member orders arrived the same or next day in the quarter. In their Q2 release, they state: “Amazon has delivered more than 1.8 billion units to the U.S. Prime members the same or next day—nearly four times the number of units delivered at those speeds by this point in 2019.” For investors, this indicates that the company may be able to improve its operating margin in the future.
One of the growth arguments from Amazon’s management is that global online retail is only a fraction - about 20% of total retail (including physical stores). This is generally true, but in order to gauge the future potential we need to know who is holding the market share, and what portion of retail will stay in physical stores.
We can use a bottom up list of all the key retail companies in the US and compare them to the total revenues from the Consumer Discretionary sector:
Total US Consumer Discretionary revenues: $3T
Top companies by revenue and market share relative to the consumer discretionary sector:
- Amazon: $331.63B (11%)
- Walmart: $512.77B (17%)
- Costco: $235.44B (7.85%)
- Home Depot: $155.75B (5.2%)
- Kroger: $148.82B (4.96%%)
- Target: $109.207B (3.64%)
- Lowe’s: $95.75B (3.2%)
- Albertsons: $78.39B (2.65%)
- Best Buy: $41.7B (1.4%)
- TJX: $39.23B (1.3%)
- Dollar General: $38.44B (1.28%)
- Dollar Tree: $28.75B (0.95%)
- BJ’s Wholesale: $19.54B (0.65%)
- Ross Stores: $18.86B (0.63%)
- DICK’S Sporting Goods: $12.51B (0.04%)
- Unallocated US Consumer Discretionary: $1133.2B (37.8%)
The peer total revenue is $1,866.787B and excluding Amazon we get $1,535.157B.
Given what we see above, I can assume that Amazon may be able to take up to 30% of the unallocated piece, and 5% of the “peer total ex. Amazon” portion. This would yield a potential market share of $748B or 25% of the US Consumer Discretionary sector. It may be unreasonable to expect for Amazon to gain more than 25% of the share because there is already established competition and not all retail should go online.
Amazon retail & 3rd party sellers would have to perform at an 8.48% CAGR over 10 years in order to achieve the $748B market share. By applying the same rate of 8.48% in the next 5 years, we get an estimated revenue of around $498B from this segment for 2028, up 50% from their current base of $331.6B.
CapEx Investments Support A Base Revenue Growth of 6.8%
While Amazon’s investments in the past have yielded high returns, their sales to capital ratio has been slowly diminishing - which isn’t unusual for a company of this size and means that Amazon needs to invest even more in order to sustain revenue growth. The sales to capital ratio for Amazon dropped from 16x pre-2017 to 2.2x in Q2’23. This means that for every dollar invested in the company, they make 2.2 dollars in sales, still great, but indicates the new level of capital investments needed to maintain growth. Note that this is partly due to the shift from retail - a high turnover business, to software -a high margin business.
We can use this sales-capital ratio to sense-check a future revenue figure that we estimated above. Looking at total reinvestment in the last 12-months, we can see that Amazon spent $59B in PPE CapEx, $5.5B in acquisition expenses, and improved working capital (-) by $15B. By netting out the $46B in depreciation, we can see that Amazon spent a total of $34B in growth reinvestments, a.k.a. growth CapEx.
Next, we take the $244B total capital employed consisting of book value of equity of $169B plus $139B total debt, less $64B cash equivalents.
So to get an estimated future revenue figure, we can use our sales to capital ratio of 2.2 and multiply it by the new capital base of $278B, consisting of $34B in total reinvestment plus the existing $244B capital. This yields an expected revenue of $611.6B for Amazon in 2025, up by 13.7% from the current $538B. As capital investments take some time to materialize, we can expect that Amazon reaches this revenue level in 2 years instead of next year, resulting in a base annual revenue growth rate of 6.8%.
This is my baseline for growth, consistent with my market share estimates from the industry and comparables’ analysis above. We can think of this as the expected growth if we don’t consider pricing and changes in future demand.
Amazon’s Advertising Is a Cost-Effective Contributor to Profitability
The company’s advertising helps merchants appear higher on Amazon’s product results page. This is now considered a normal part of doing business on Amazon and most sellers will engage in advertising at one point or another. Amazon is the go-to place in the US for customers that want to buy goods, and being behind on advertising may be something sellers can’t afford.
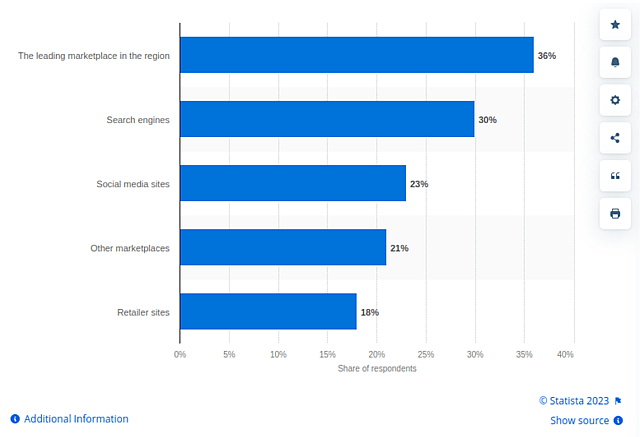
Statista: Leading online sources where consumers worldwide search for products in 2022
When calculating (1, 2) the average of advertising as a portion of total online sales (main + 3rd party, ex. physical), I come up with 11.4%. The number is fairly consistent across quarters, and I expect it to continue along the same lines in the future. This will be my basis for calculating advertising revenues in 2028 below.
Because of this, it makes sense to view advertising revenues as a stable portion of retail revenue, and we can expect it to grow closely with the main segment.
Looking at profitability, I find Amazon’s advertising segment comparable to Meta’s pre “Metaverse” days, as the business is well-defined with a clear mission to provide advertising to customers. We can argue that there are few operating expenses in this segment, but the company has to make it viable for sellers to advertise and earn their own cost of capital.
Given the low expected costs for running this service, I assume that advertising operating profits will scale well and move from 11% (the US industry average) to 30% as Amazon onboards more sellers.
Amazon Has The Best Value Proposition In The Streaming Wars
The streaming segment - Amazon Prime, is a smart way to utilize AWS infrastructure to reduce server costs. An added benefit for consumers is that it fits well into the Prime ecosystem.
In general, the streaming business is quite volatile at the moment and is experiencing further fragmentation that consumers may not be able to keep up with. Notable competitors in this space are Netflix, Disney, Warner Bros Discovery (owns HBO), and Apple. Disney also owns 67% of Hulu and the remainder is owned by Comcast.
It is estimated (1, 2) that 85% of US households have at least one streaming service and 60% use four or more services - likely a combination of ad-supported and subscriptions. However, given the monthly expenses, the US consumer needs to pay for multiple streamers, and it is unlikely that the landscape will stay this fragmented. Winners will emerge, while the rest settle into their own niche. The current front-runner is Netflix with over 238.4 million global subscriptions, and is one of the more affordable standalone options even with the price hikes, while Disney+ subscribers dropped from 164 million in 2022 to 146.7 million in Q3 '23.
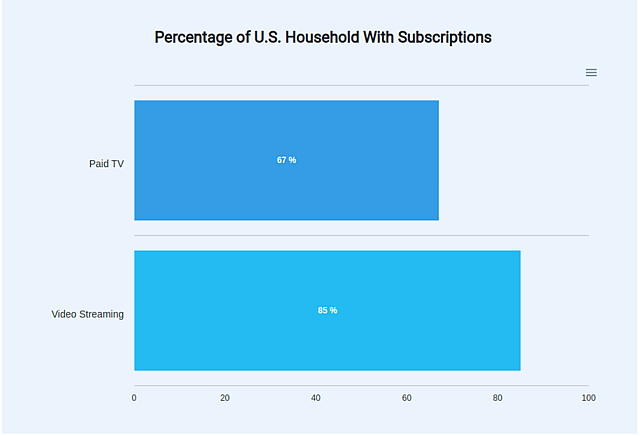
Cloudwards: Percentage of U.S. Households with Subscriptions
With more than 200 million Prime members, Amazon Prime Video has a good chance of becoming the dominant platform, as users have the option to buy Prime Video as an affordable standalone subscription or get it included in a full Prime membership along with the remaining retail, gaming, pharmacy services, etc. Netflix is expanding into gaming and is in the lead for original content, but the value proposition of Amazon seems better when considering Prime as a whole package.
The drawback for Prime Video is the lack of quality original content. The highlights of the latest earnings call were the premieres of AIR, The Marvelous Mrs. Maisel, Citadel, and Jury Duty. The absence of news on the “Rings of Power” title indicates that the company made a bad investment that was supposed to be their flagship series which they invested close to $1bn into.
I view Prime Video as a supplementary service to the Amazon ecosystem, and don’t expect subscription services to gain a larger operating margin than 5% by 2028. My rationale for this stems from the comparison of Costco’s operating margin of 2.9% which is similarly driven by memberships, with a premium for Amazon’s digital media.
Amazon is Starting to Optimize for Profitability
A signal that management is aware of the future decline in growth is the change in rhetoric from growth to profitability, which was evident as Amazon shifted (1, 2, 3) to an optimization of headcount and operations in 2022. While the US consumer has shown resilience in Q2’23, the high growth rates will be difficult to maintain on account of the already large revenue baseline of $538B in the last 12-months.
I believe that Amazon will execute on profitability in the next decade, and net income will converge to 60% of operating income by 2028.
Enter Walmart - The New eComm Giant
Excluding Alibaba, Walmart is Amazon’s closest competitor in retail. While both Amazon and Walmart have a different business model, Walmart being focused on physical and Amazon on Online retail, it is now apparent that Walmart is entering the eCommerce space as a top priority. Walmart is also investing in its own cloud infrastructure with a hybrid approach, possibly paving the way for other large enterprises to reduce their dependence on 3rd party cloud solutions like Amazon.
The foundational question to answer when comparing the business models of Walmart to Amazon is:
“Is developing an online delivery business cheaper than developing a physical retail chain?”
While both companies have domain expertise in their respective field, it seems likely that developing an eComm operation is easier once you have a foundation of physical stores, and a free cash flow positive business.
For consumers, the shopping experience is conditional on residential density, the average purchase basket, demand, and impulse buying vs planned behavior. However, we can see that the best of both worlds would be a combination of physical stores with an eCommerce solution - Which is exactly what Walmart is building.
In Q1 2022, Walmart made $22.1B of the total $151B via eCommerce, representing 14.6% of the quarterly net sales. It is also investing a majority (around 60%) of its CapEx into “Supply chain, customer-facing initiatives and technology” including eCommerce. This makes Walmart a profitable retail business with stores all over the country, which it can leverage as distribution warehouses.
On the international front, Walmart is targeting and successfully expanding into Central America, China and Canada (p. 15), while Amazon is growing in India. Both are viable avenues for the respective companies and are more appropriate for the native retail shopping cultures. By 2025, Amazon India has a goal to enable cumulative ecommerce exports of $20 billion, up by 185% from the current $7B.
The takeaway is that competition will make it harder for Amazon to increase its current eComm market share, while traditional retail chains may have an easier time adapting eCommerce.
Amazon Gaming Needs To Level Up
While the strategy to leverage AWS servers in order to reduce the cost of maintaining online games is a good direction, it seems that Amazon has difficulties executing. The company has two full feature multiplayer games, New World and Lost Ark (as publisher), as well as at least six in the pipeline.
Both titles are attempting to compare with Activision-Blizzard’s World of Warcraft, but have failed to be more than content iterators with microtransactions. New World is a single purchase MMO aimed at western audiences, with a daily player base estimated around 75K, and 13.5M total players. At a base price point of $40 this game has made at least $550M in revenue, indicating that the company is still pursuing the growth strategy before monetization. The game recently got a large content expansion called “Blood of the Sands”, and the main complaint is that management didn’t address core mechanics, but instead focused on adding more content. While reviews on steam are mostly positive, interest may be flattening again.
Lost Ark is a free to play - pay to advance multiplayer game, targeting both western and East Asian audiences with a Korean culture tilt. The game is currently more successful than New World and has 1.1M estimated daily and 43.5M estimated total players.
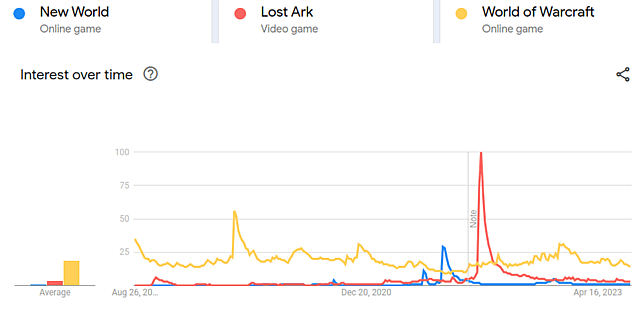
Google Trends: Search Interest in Amazon’s Game Titles vs. Top Peer (World of Warcraft)
In summary, while Amazon is managing to leverage its AWS infrastructure to produce cost-effective games, it still has difficulties with the execution and lacks titles. One possible way to address the second issue may be acquisitions of independent game studios.
In-House Chips Will Boost AWS Performance
Amazon’s AWS is the leading cloud infrastructure platform with over 200 services, capturing 32% of the global cloud market share. Its closest peers, Microsoft’s Azure has 23% and Google Cloud is at 10% market share. The company is constantly lowering its cost structure and has managed to produce an AWS Q2’23 operating margin of 24.2% (p. 19), down from 32% YoY. This shows that AWS is Amazon’s most profitable segment, and that the reduction of costs isn’t enough to offset the decline in sales.
One way the company is attempting to mitigate costs is to produce its own data center chips. This is a great strategy and is reducing the dependence on hardware manufacturers like NVIDIA and AMD. To that end, Amazon has produced its own Gravitron chip, based on the ARM architecture. While technological innovation is enabling high performance increases in 3rd party manufacturer chips, such as NVIDIA’s accelerated GPUs, Amazon has also developed its AI GPU chip Trainium (1, 2, 3) which promotes cost savings in training AI models. It stands to reason that Amazon can support part of its data-center needs with in-house hardware and pace the remainder with demand growth in order to economize costs.
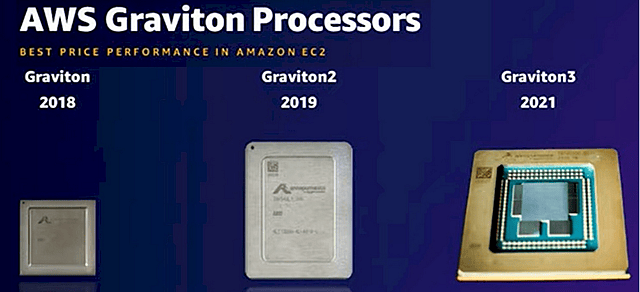
Nextplatform: Amazon’s Gravitron Evolution
Software architecture improvements are also a notable mention. Recently, Amazon improved its cost structure on parts of its Prime Video software by switching to a monolithic approach and consolidating microservices. For investors, the takeaway is that as the company iterates its cloud services, we can see performance increases based on software optimization and innovation.
Given the improvements, I'm anticipating AWS to continue cutting costs and regain an operating profit margin of 30%. As for the growth in the segment, I expect it to be lower than the cloud industry growth of 14% (discussed below) to 8.9% as the company has captured a large portion of the “easy” clients. Conversely, I don’t expect Amazon to onboard new retail, or media companies into AWS as they are direct competitors and would likely move to one of the cloud peers. AWS already has a high revenue base, and extrapolating past performance may not be appropriate.
Stock Based Compensation Is Affecting The Incentive Structure
Stock based compensation (SBC) is an expense that investors bear to cover employee payroll, not free money. It is frequently expected in young growth companies and shows up as a higher cost of equity. Companies use this as an alternative to basic share issuance and is a form of equity financing. The mix of debt and equity financing in a publicly listed company is what makes its cost of capital decrease and improves its competitiveness - hence, few privately owned companies can stand up to publicly listed stocks.
As most other public companies, Amazon has been using SBC to cover a portion of their expenses and employee incentive structure. Unfortunately, this has grown as a percent of revenues as the company progressed instead of stabilizing. As pointed out by MBI, SBC as a % of sales has increased from 1.6% in 2013 to 5.3% in Q2 '23. There are numerous concerning points from the current state:
- Investors are subsidizing a company with barely any free cash flow margin.
- The incentive structure is tied to SBC and white collar employees may start using short-term incentives to meet internal targets, instead of maximizing shareholder value.
- Amazon is expanding its product portfolio and approaching a conglomerate status. This, coupled with the SBC incentive structure, lays the foundation for short-sighted decision making.
The share count has risen by an average of 0.5% per year in the last two years, and this by itself is not a problem. The issue is the way in which investors are diluted may lead to perverse short-term incentives within the company.
Industry Catalysts
Amazon Is The Cloud Leader - Making It Harder To Capture Additional Market Share
The cloud computing market is valued at $619B in 2023, and expected to grow by 14% (revised down from 18.5%) annually. It is expected to reach $1.55T in 2030. However, as I outlined in my Alphabet analysis, I think that this forecast is still optimistic and based on the state of market optimism when it was conducted. I don’t expect the cloud segment to grow more than $1.2T. This is because a good portion of large companies have already onboarded part or most of their services to the cloud, and competition as well as innovation will increase in the years ahead - ultimately producing cheaper services which will impact the cloud market. That means that I expect the cloud segment to grow at a CAGR of 9.9% reaching 1.2T in 2030.
According to Synergy Research, Amazon had a Q1 market share for the cloud of 32%. Assuming a retained market share in Q2, that would imply that with AWS revenues of $88.78B and a 32% share (88.78/0.32), the total cloud market is $277.4B at least by what the publication counts as cloud spend. By applying the previous growth forecast of 9.9% up to 2030, we get a narrower cloud market scope of $537B, where it is more reasonable to assume that AWS can retain a 30% market share. This would grow AWS’s revenues to $161B in 2030, and $136B in 2028, with a CAGR of 8.9%. The reason I didn’t use the 9.9% rate is because I assume that AWS’s market share will stabilize around 30% instead of the current 32%.
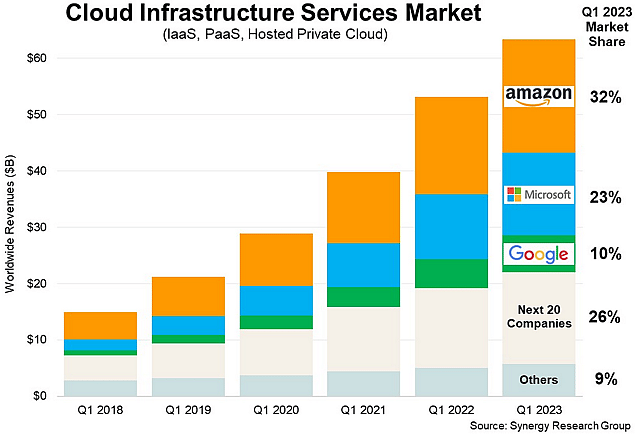
Synergy Research Group: Cloud Infrastructure Services Market
If we go by management’s forecasts, as Andy Jassy the CEO of Amazon has commented that 90% of Global IT spend is still on premise, it would mean that if everyone switched to the cloud, the market today would amount to about $2.7T. I think management is forecasting the absolute best case scenario for them. Not all companies need to switch their on-premise infrastructure, and not all of that mentioned spend is comparable to cloud infrastructure, which is why I didn’t use that assessment in my analysis.
In summary, I expect AWS to retain a market share of 30%, growing by 8.9% p.a. to reach $136B revenues in 2028. With an operating margin of 30%, I estimate that AWS will make $40.8B in operating profits in that year.
Consumption Under Pressure From Deteriorating US - China Relations
Consumer discretionary sales have grown between a 5.15% and 6.57% CAGR in the last 10 years, and seem to be stagnating since 2022. The sector will expand at least nominally by 4% p.a. based on inflation but may not experience more than 2% real growth as consumer demand saturates in the next two years. There are factors that can pressure growth and turn it into a stagnation cycle.
It is important to note that Amazon may experience headwinds by a reduction in US imports from China. In the latest trade export value reports, (1, 2, 3) China’s exports in the US dropped by 14.19%, as opposed to an expected 12.4% decline. Categories like computers, steel, textiles, plastics and toys were most affected. The demand drop was likely caused by increasing inflation, coupled with rising interest rates and a drop in consumer savings.
The future of this trend is uncertain because of the ongoing rise in protectionist trade policies between the US and China. International trade has experienced an increase in cost as the US enacted and continued tariffs (1, 2, 3) on imports from China. Consequently, China retaliated by enacting its own tariffs (1, 2) amounting to a total tax of approximately $13.2B between 2018 and 2020.
Amazon will be affected by an increase in tensions between the US and China, since between 63% to 75% of their 3rd party seller products come from China (1, 2, 3), and I will further assume that a substantial amount are manufactured in China but packaged abroad.
While everyone has been talking about this for an extended period, it is worth factoring-in as a significant risk factor for the affordability of goods, and the likelihood of Amazon’s Third Party seller ecosystem being able to thrive.
For these reasons I expect consumer goods to grow by an average of 6% annually, and is the minimum threshold I expect Amazon to achieve on its retail segments (online, 3rd party, and physical) over the next 10 years. I assume trade stagnation and protectionist policies to continue in the next three to five years before we experience a recovery cycle.
Assumptions
Revenue
Based on my calculated reinvestment-based growth rate, headwinds from international trade, expectations for stagnation of the retail sector, and the approaching maturity of Amazon’s retail reflected in producing nominal growth close to the rate of the economy, I assume that online retail (Amazon & 3rd party sellers) revenue will grow at a CAGR of 8.5%, and reach around $498B in 2028.
I consider the advertising segment as a stable portion of online retail and expect it to grow by 6% annually, reaching $57B in 2028.
While the cloud is an exciting segment, the existing large revenue base of $88.8B for AWS limits growth opportunities, and I assume that AWS keeps growing at an average rate of 8.9% per year, reaching $136B in revenues and retaining a 30% market share in 2028.
I view Amazon’s ecosystem as having a better value proposition for subscription services (ex. gaming) and expect it to grow 15% next year, converging down to a 10% growth rate, thus producing $71B in annual recurring revenue by 2028.
I expect Amazon’s remaining segments to grow by 4% - close to the rate of the economy, without any future positive surprises.
In total, I estimate that Amazon produces around $808B in revenue by fiscal year 2028, growing at an average 8.5% rate.
Profit Margins
I estimate that Amazon’s retail operations (ex. physical stores) become even more profitable than the current 3.3% and converge to 13% in 2028. This would yield around $65B in operating profit.
I assume that both the subscription and the “other” segment will have a 5% operating margin and yield $5.7B in 2028.
I view AWS and the advertising segment as the company’s most profitable branches and estimate a 30% margin on both. This would produce a combined operating profit of $58B for 2028.
In total, I estimate that Amazon produces around $128.5B in operating profits (i.e. before interest and taxes) in 2028, representing an operating margin of 16%.
Earnings
I assume that earnings start ramping up after three years and approach to 60% of operating income. This means that in five years, I expect Amazon to produce a net income of $77B, representing a net profit margin of 9.5%.
Return on Capital
I assume that Amazon regains higher return on capital because of the scale of the business and capitalizing on innovation. I estimate that it moves from the current 5.4%, up to 15% as the company’s focus switches from growth to monetization, even surpassing the 10% ROCE from 3 years ago. This has implications on the need in future CapEx and the company can produce more profits as a result, which is why I believe the 9.5% net profit margin is achievable.
Share Count
I imagine it will be difficult for the company to reverse the share dilution trend in the next three years, but expect Amazon to start continuously buying back stock after that. Because of this, I expect the total diluted share count to net out and revert to 10.5B. (3 years dilution of 0.7%, 2 years buybacks of 0.5%)
Risks
Amazon May Breakthrough Retail Growth Avenues
I assume that Amazon’s retail may grow at a relatively slow pace, which runs the risk of underestimating the U.S. consumers’ purchasing power resilience, something that seasoned investors warn against. Amazon may surprise on the upside and find a successful way to address the EU market, which would significantly change the valuation.
Advertising May Not Be Free Money For Long
I consider the advertising business as a profitable branch, however it is constrained to 3rd party sellers, who may find alternative advertising platforms and their % of revenues may be squeezed by competitors or pushed out by Amazon’s own low cost retail network.
Competitors May Enact Barriers To Popular Streaming Content
Amazon’s original video and games have yet to produce enough quality content, and competitors may decide to raise licensing fees of their content, further limiting the offering of Amazon Prime Video. Should the company fail to develop their gaming branch, customers may not find the Prime ecosystem appealing enough to subscribe to in order to access its games.
Stabilization In The Pacific
China’s economy may surprise on the downside, and its government may pivot to a more diplomatic approach with the West. This may restart trade negotiations and grant the US consumer further access to cheap goods.
Innovation and Strong Cloud Leadership
Amazon’s cloud leadership may be further strengthened by providing appealing services to a number of medium and small cap companies, which may decide to build on and migrate to AWS. Its investments in own chips, and AI computing may allow AWS to provide cost-effective and highly competitive offerings to customers. Amazon has a history of being able to take market share from industries, and high-margin peers like Google and Microsoft may not be able to manage competing with cheaper software infrastructure offerings.
Have other thoughts on Amazon.com?
Create your own narrative on this stock, and estimate its Fair Value using our Valuator tool.
Create NarrativeHow well do narratives help inform your perspective?
Disclaimer
Simply Wall St analyst Goran_Damchevski holds no position in NasdaqGS:AMZN. Simply Wall St has no position in any companies mentioned. Simply Wall St may provide the securities issuer or related entities with website advertising services for a fee, on an arm's length basis. These relationships have no impact on the way we conduct our business, the content we host, or how our content is served to users. This narrative is general in nature and explores scenarios and estimates created by the author. The narrative does not reflect the opinions of Simply Wall St, and the views expressed are the opinion of the author alone, acting on their own behalf. These scenarios are not indicative of the company's future performance and are exploratory in the ideas they cover. The fair value estimate's are estimations only, and does not constitute a recommendation to buy or sell any stock, and they do not take account of your objectives, or your financial situation. Note that the author's analysis may not factor in the latest price-sensitive company announcements or qualitative material.
