


Last Update 10 Nov 25
Fair value Increased 0.16%EGP: Dividend Increase And Guidance Will Shape Outlook Amid Sector Shift
Analysts have raised their average price target for EastGroup Properties slightly, moving from approximately $191.89 to $192.21. This change reflects continued optimism after the company's recent Quarterly results and improved private market valuations.
Analyst Commentary
Analyst reactions to EastGroup Properties’ recent performance and outlook have highlighted both positive and cautionary perspectives regarding the company’s prospects and valuation.
Bullish Takeaways- Bullish analysts have raised price targets, citing a solid quarterly report and continued consistency in earnings execution.
- Upward revisions to price targets reflect positive sentiment about improved private market valuations and a favorable growth runway.
- Some believe a tightening of guidance signals management’s operational discipline, supporting ongoing confidence in long-term fundamentals.
- The industrial sector outlook, particularly for 2026, is viewed positively as tenant demand may loosen, potentially driving leasing activity and space absorption.
- Bearish analysts point to a slower development leasing pace, which has led to more modest full-year development start targets.
- Despite improved private market values, there are concerns that recent affirmations of guidance may have been perceived as underwhelming, affecting recent stock performance.
- Some caution that growth projections may be tempered by short-term operational slowdowns and the timing of tenant leasing decisions.
What's in the News
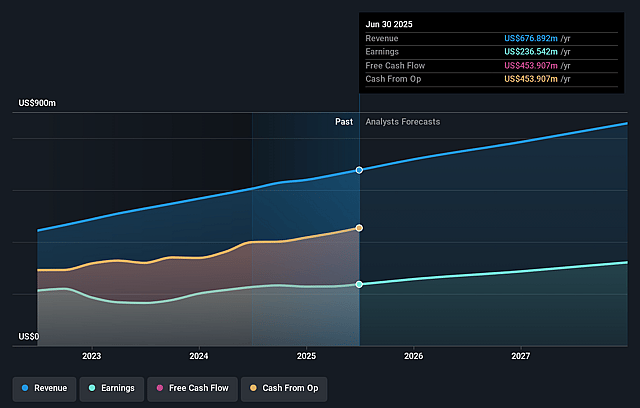
- EastGroup Properties provided earnings guidance for the fourth quarter and full year 2025, projecting quarterly net income attributable to common stockholders in the range of $66,611,000 to $68,723,000. Annual net income is projected to be in the range of $256,276,000 to $258,388,000. (Key Developments)
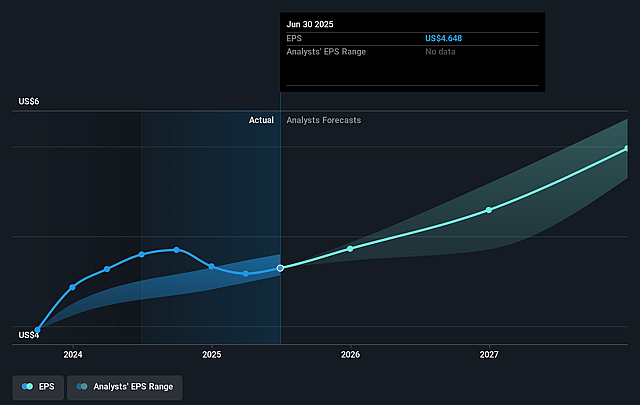
- Projected earnings per diluted share are expected to be between $1.25 and $1.29 for the fourth quarter. For the full year 2025, the range is projected to be between $4.85 and $4.89. (Key Developments)
- The Board of Directors approved a 10.7% increase in the quarterly dividend, raising it to $1.55 per share. This increase is effective October 15, 2025, for shareholders of record as of September 30, 2025. (Key Developments)
- This marks the 183rd consecutive quarterly cash dividend, reflecting a new annualized dividend rate of $6.20 per share. (Key Developments)
Valuation Changes
- Consensus Analyst Price Target has risen slightly, moving from $191.89 to $192.21.
- The Discount Rate increased moderately from 8.02% to 8.49%.
- The Revenue Growth projection has decreased modestly, from 10.58% to 10.10%.
- Net Profit Margin is up from 35.98% to 37.17%.
- The future P/E ratio has edged down slightly, from 46.43x to 46.20x.
Key Takeaways
- Growing demand in Sunbelt markets and limited new supply support strong pricing power and earnings growth for EastGroup's logistics-focused portfolio.
- Strategic expansion and a robust balance sheet position the company to capitalize on long-term economic and e-commerce-driven tailwinds.
- Reliance on select regions facing economic, regulatory, and climate headwinds threatens revenue growth, rental performance, and earnings stability while constrained capital access limits future development.
Catalysts
About EastGroup Properties- EastGroup Properties, Inc. (NYSE: EGP), a member of the S&P Mid-Cap 400 and Russell 2000 Indexes, is a self-administered equity real estate investment trust focused on the development, acquisition and operation of industrial properties in high-growth markets throughout the United States with an emphasis in the states of Texas, Florida, California, Arizona and North Carolina.
- Structural US population growth and migration to Sunbelt markets continues to underpin robust demand for modern industrial/logistics properties, directly benefiting EastGroup's core portfolio and positioning the company for sustained revenue and NOI growth as these regions outpace national averages.
- Persistent e-commerce expansion and ongoing supply chain modernization are ensuring elevated leasing spreads and high occupancy in EastGroup's infill, last-mile logistics facilities, supporting above-average rental rate growth and driving resilient net margins.
- Industry-wide constraints on new supply-stemming from ongoing zoning and land scarcity-are enabling EastGroup to maintain its pricing power and consistently high utilization, even in a more cautious capital environment, supporting stable and potentially accelerating earnings growth as macro uncertainty dissipates.
- EastGroup's strategic expansion in high-barrier, technology-driven Sunbelt metros (like Raleigh, Nashville, and Austin) is leveraging long-term regional economic tailwinds, increasing portfolio quality and diversification, and supporting long-term asset appreciation and NAV growth.
- Management's strong balance sheet, ample land bank, and ability to accelerate development starts when demand rebounds ensures the company can capitalize early on secular demand trends, translating to scalable FFO growth and further upside in earnings as market sentiment normalizes.
EastGroup Properties Future Earnings and Revenue Growth
Assumptions
How have these above catalysts been quantified?- Analysts are assuming EastGroup Properties's revenue will grow by 10.8% annually over the next 3 years.
- Analysts assume that profit margins will increase from 34.9% today to 36.9% in 3 years time.
- Analysts expect earnings to reach $339.7 million (and earnings per share of $6.23) by about September 2028, up from $236.5 million today.
- In order for the above numbers to justify the analysts price target, the company would need to trade at a PE ratio of 45.3x on those 2028 earnings, up from 37.1x today. This future PE is greater than the current PE for the US Industrial REITs industry at 26.9x.
- Analysts expect the number of shares outstanding to grow by 7.0% per year for the next 3 years.
- To value all of this in today's terms, we will use a discount rate of 7.95%, as per the Simply Wall St company report.
EastGroup Properties Future Earnings Per Share Growth
Risks
What could happen that would invalidate this narrative?- Prolonged uncertainty and slow decision-making among larger tenants, particularly due to ongoing tariff and geopolitical issues, has resulted in lengthened development leasing timelines and reduced development starts, which could weigh on both revenue growth and near-term earnings scalability.
- Exposure to markets such as Southern California and other regions experiencing multiple consecutive quarters of negative net absorption has increased the need for rent concessions and more aggressive pricing, negatively impacting rent growth and net margins from those assets.
- Persistent high interest rates and limited differentiation between the cost of debt and equity may constrain access to affordable capital, compress valuation multiples, and potentially limit EastGroup's ability to fund new developments or acquisitions, affecting long-term FFO growth.
- Concentrated exposure in select Sunbelt and Western/Southern US markets, some of which (e.g., California, Phoenix) are increasingly facing climate risk, water scarcity, and regulatory headwinds, reduces geographic diversification and could adversely affect occupancy, rental growth, and property values over time.
- Tenant health in certain regions-especially California-remains an above-average risk, as a disproportionate share of bad debt write-offs are concentrated there; rising property taxes, insurance, and higher vacancy in these regions could compress net operating income and earnings stability.
Valuation
How have all the factors above been brought together to estimate a fair value?- The analysts have a consensus price target of $188.278 for EastGroup Properties based on their expectations of its future earnings growth, profit margins and other risk factors. However, there is a degree of disagreement amongst analysts, with the most bullish reporting a price target of $218.0, and the most bearish reporting a price target of just $174.0.
- In order for you to agree with the analyst's consensus, you'd need to believe that by 2028, revenues will be $921.3 million, earnings will come to $339.7 million, and it would be trading on a PE ratio of 45.3x, assuming you use a discount rate of 8.0%.
- Given the current share price of $164.92, the analyst price target of $188.28 is 12.4% higher.
- We always encourage you to reach your own conclusions though. So sense check these analyst numbers against your own assumptions and expectations based on your understanding of the business and what you believe is probable.
How well do narratives help inform your perspective?
Disclaimer
AnalystConsensusTarget is a tool utilizing a Large Language Model (LLM) that ingests data on consensus price targets, forecasted revenue and earnings figures, as well as the transcripts of earnings calls to produce qualitative analysis. The narratives produced by AnalystConsensusTarget are general in nature and are based solely on analyst data and publicly-available material published by the respective companies. These scenarios are not indicative of the company's future performance and are exploratory in nature. Simply Wall St has no position in the company(s) mentioned. Simply Wall St may provide the securities issuer or related entities with website advertising services for a fee, on an arm's length basis. These relationships have no impact on the way we conduct our business, the content we host, or how our content is served to users. The price targets and estimates used are consensus data, and do not constitute a recommendation to buy or sell any stock, and they do not take account of your objectives, or your financial situation. Note that AnalystConsensusTarget's analysis may not factor in the latest price-sensitive company announcements or qualitative material.