


Key Takeaways
- Strategic positioning in LNG, data centers, and space exploration promises robust project pipelines and potential revenue growth.
- Increased order volume and growth in higher-margin aftermarket services signal enhanced future earnings and margin improvement.
- Geopolitical tensions and market uncertainties, coupled with macroeconomic risks, may threaten Chart Industries' revenue forecasts and impact operating margins and liquidity management.
Catalysts
About Chart Industries- Engages in the designing, engineering, and manufacturing of process technologies and equipment for the gas and liquid molecules in the United States and internationally.
- Chart Industries is experiencing a significant increase in order volume, including a 17.3% increase from the first quarter of 2024 to the first quarter of 2025, which could enhance future revenue as these orders are fulfilled.
- The integration of Howden has resulted in cost synergies, contributing to an expansion in adjusted operating income margin by 190 basis points, which is expected to bolster future net margins.
- The company is strategically positioned in high-demand markets such as LNG, data centers, and space exploration, providing a strong pipeline of future projects and potential for significant revenue growth.
- Chart Industries is focusing heavily on growing its aftermarket service and repair business, which comprises a third of its revenue and offers higher margins, potentially improving overall earnings.
- The company plans to mitigate tariff impacts with strategic actions, such as flexible manufacturing and cost pass-throughs, which should help protect net margins and support the financial guidance for 2025.
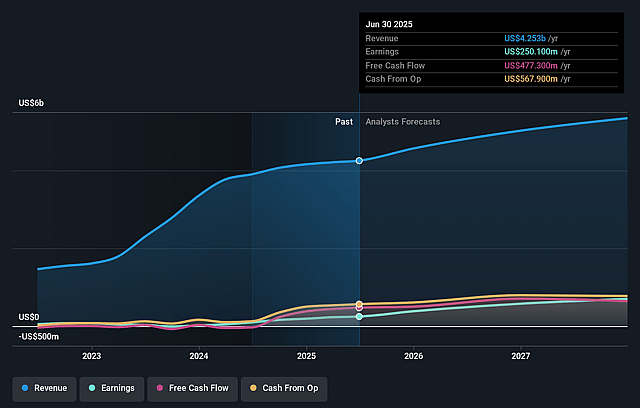
Chart Industries Future Earnings and Revenue Growth
Assumptions
How have these above catalysts been quantified?- Analysts are assuming Chart Industries's revenue will grow by 9.2% annually over the next 3 years.
- Analysts assume that profit margins will increase from 5.9% today to 13.4% in 3 years time.
- Analysts expect earnings to reach $740.1 million (and earnings per share of $16.06) by about September 2028, up from $250.1 million today. However, there is some disagreement amongst the analysts with the more bearish ones expecting earnings as low as $605 million.
- In order for the above numbers to justify the analysts price target, the company would need to trade at a PE ratio of 19.5x on those 2028 earnings, down from 35.8x today. This future PE is lower than the current PE for the US Machinery industry at 24.7x.
- Analysts expect the number of shares outstanding to grow by 6.88% per year for the next 3 years.
- To value all of this in today's terms, we will use a discount rate of 8.99%, as per the Simply Wall St company report.
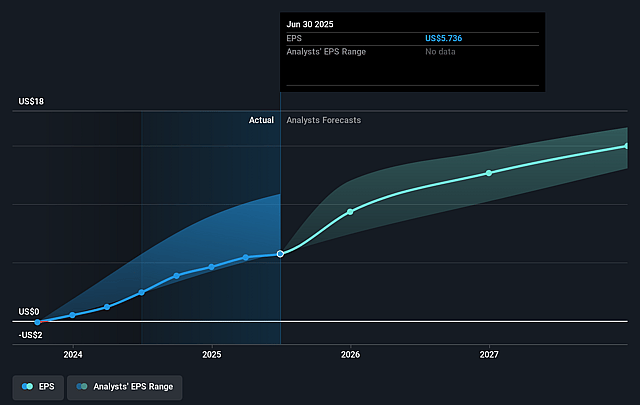
Chart Industries Future Earnings Per Share Growth
Risks
What could happen that would invalidate this narrative?- Concerns about the company's reliance on tariff exemptions and regional sourcing as mitigation strategies could pose a risk if geopolitical tensions escalate, potentially impacting operating margins and costs.
- The industrial gas and hydrogen markets, particularly in the Americas, are identified as uncertain, which may affect revenue growth forecasts in these sectors.
- The first quarter's negative free cash flow, driven by seasonal cash outlays, could raise concerns among investors about liquidity management and net debt reduction targets.
- Uncertainties around timing and realization of large backlog projects, particularly in LNG and complex sectors like space exploration and nuclear, may lead to unexpected revenue fluctuations if projects are delayed or canceled.
- The macroeconomic risks and potential slowdown in industrial gases and other sectors point to vulnerabilities in demand, which could impact anticipated revenues and margins, especially if current backlog-driven visibility is disrupted.
Valuation
How have all the factors above been brought together to estimate a fair value?- The analysts have a consensus price target of $206.667 for Chart Industries based on their expectations of its future earnings growth, profit margins and other risk factors. However, there is a degree of disagreement amongst analysts, with the most bullish reporting a price target of $227.0, and the most bearish reporting a price target of just $169.0.
- In order for you to agree with the analyst's consensus, you'd need to believe that by 2028, revenues will be $5.5 billion, earnings will come to $740.1 million, and it would be trading on a PE ratio of 19.5x, assuming you use a discount rate of 9.0%.
- Given the current share price of $199.34, the analyst price target of $206.67 is 3.5% higher. The relatively low difference between the current share price and the analyst consensus price target indicates that they believe on average, the company is fairly priced.
- We always encourage you to reach your own conclusions though. So sense check these analyst numbers against your own assumptions and expectations based on your understanding of the business and what you believe is probable.
Have other thoughts on Chart Industries?
Create your own narrative on this stock, and estimate its Fair Value using our Valuator tool.
Create NarrativeHow well do narratives help inform your perspective?
Disclaimer
AnalystConsensusTarget is a tool utilizing a Large Language Model (LLM) that ingests data on consensus price targets, forecasted revenue and earnings figures, as well as the transcripts of earnings calls to produce qualitative analysis. The narratives produced by AnalystConsensusTarget are general in nature and are based solely on analyst data and publicly-available material published by the respective companies. These scenarios are not indicative of the company's future performance and are exploratory in nature. Simply Wall St has no position in the company(s) mentioned. Simply Wall St may provide the securities issuer or related entities with website advertising services for a fee, on an arm's length basis. These relationships have no impact on the way we conduct our business, the content we host, or how our content is served to users. The price targets and estimates used are consensus data, and do not constitute a recommendation to buy or sell any stock, and they do not take account of your objectives, or your financial situation. Note that AnalystConsensusTarget's analysis may not factor in the latest price-sensitive company announcements or qualitative material.